 7
7peptides
spectra
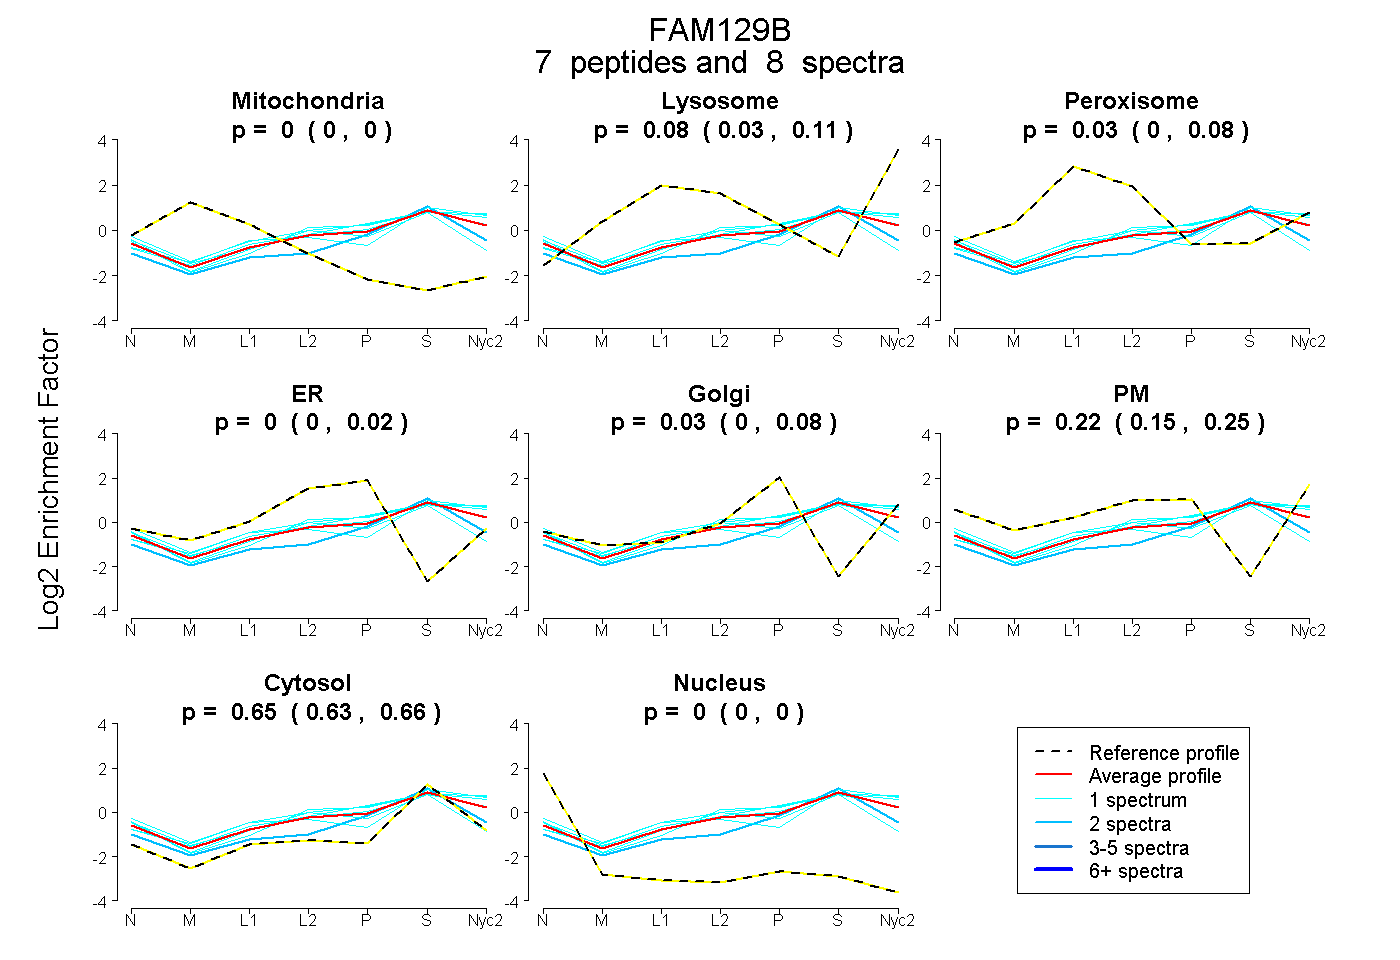
0.000 | 0.000
0.029 | 0.113
0.000 | 0.076
0.000 | 0.018
0.000 | 0.080
0.148 | 0.249
0.635 | 0.663
0.000 | 0.000
8peptides
spectra
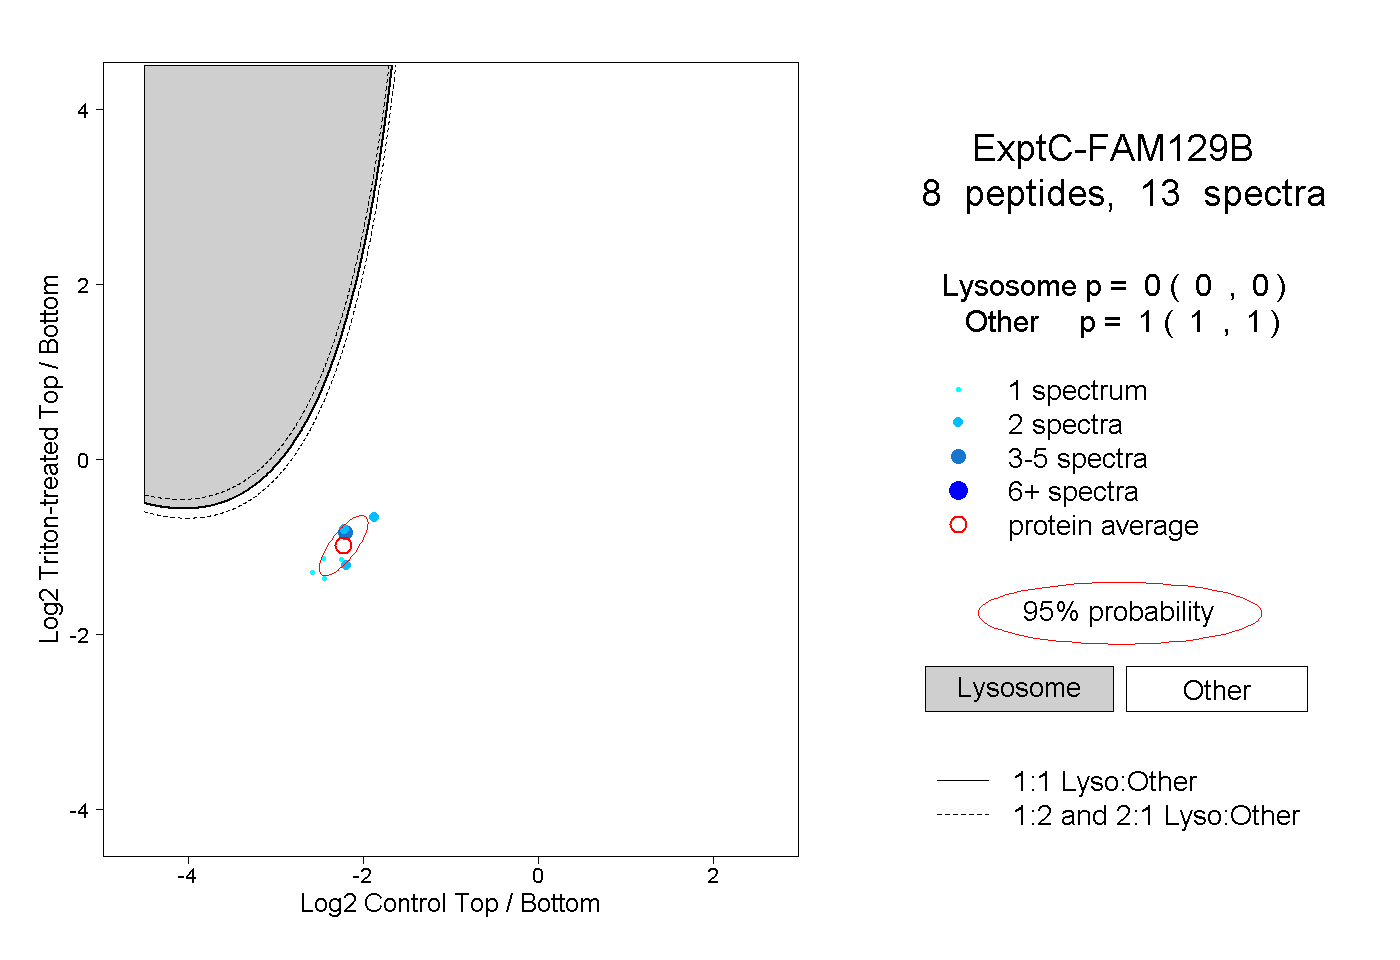
0.000 | 0.000
1.000 | 1.000
1peptide
spectrum
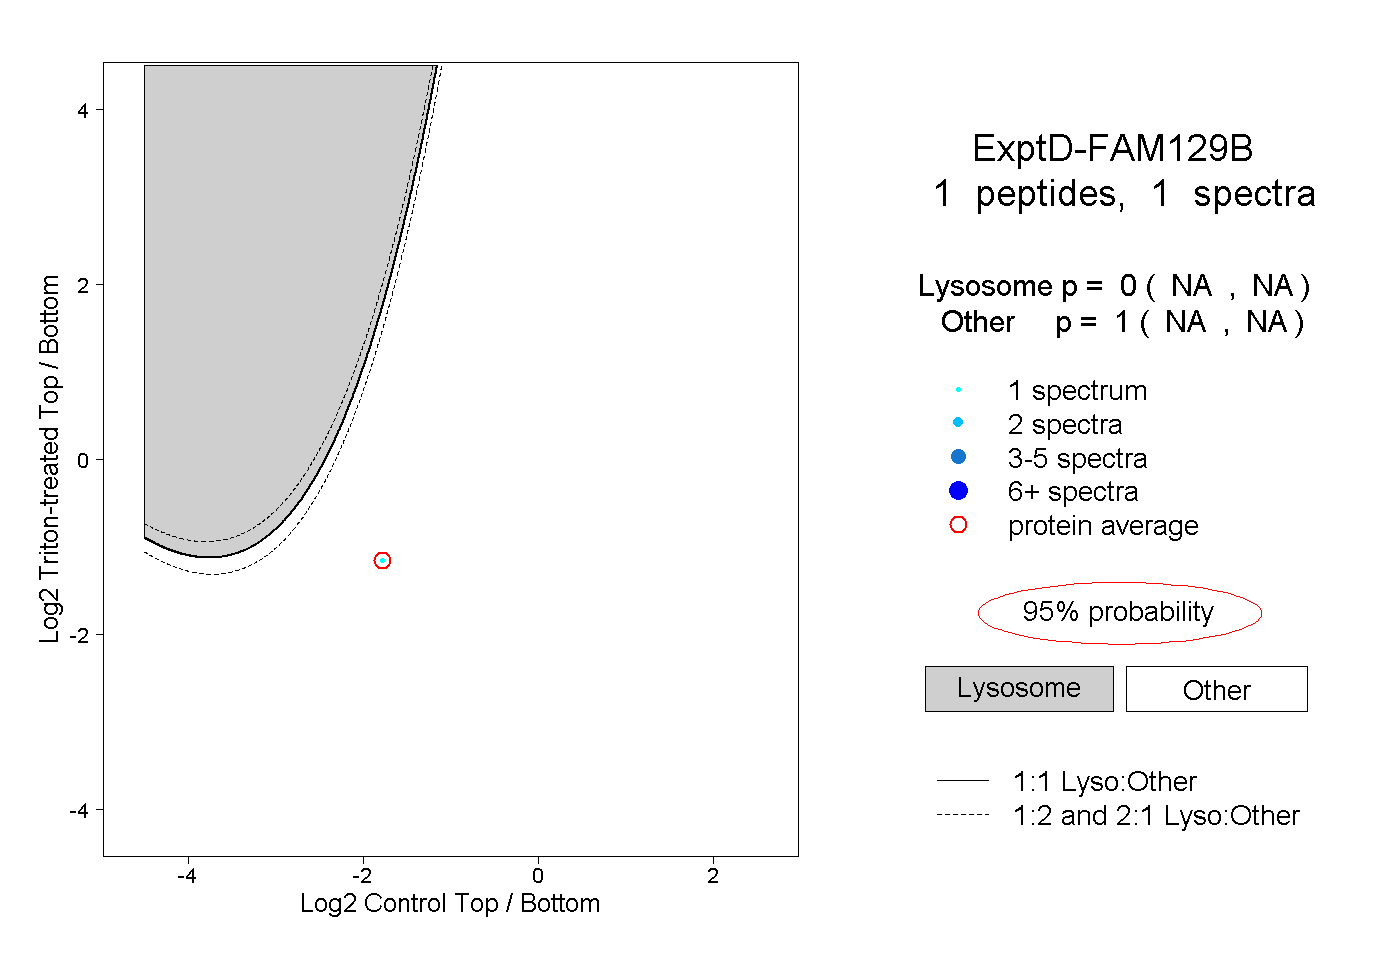
NA | NA
NA | NA