 7
7peptides
spectra
0.000 | 0.000
0.029 | 0.113
0.000 | 0.076
0.000 | 0.018
0.000 | 0.080
0.148 | 0.249
0.635 | 0.663
0.000 | 0.000
8peptides
spectra
0.000 | 0.000
1.000 | 1.000
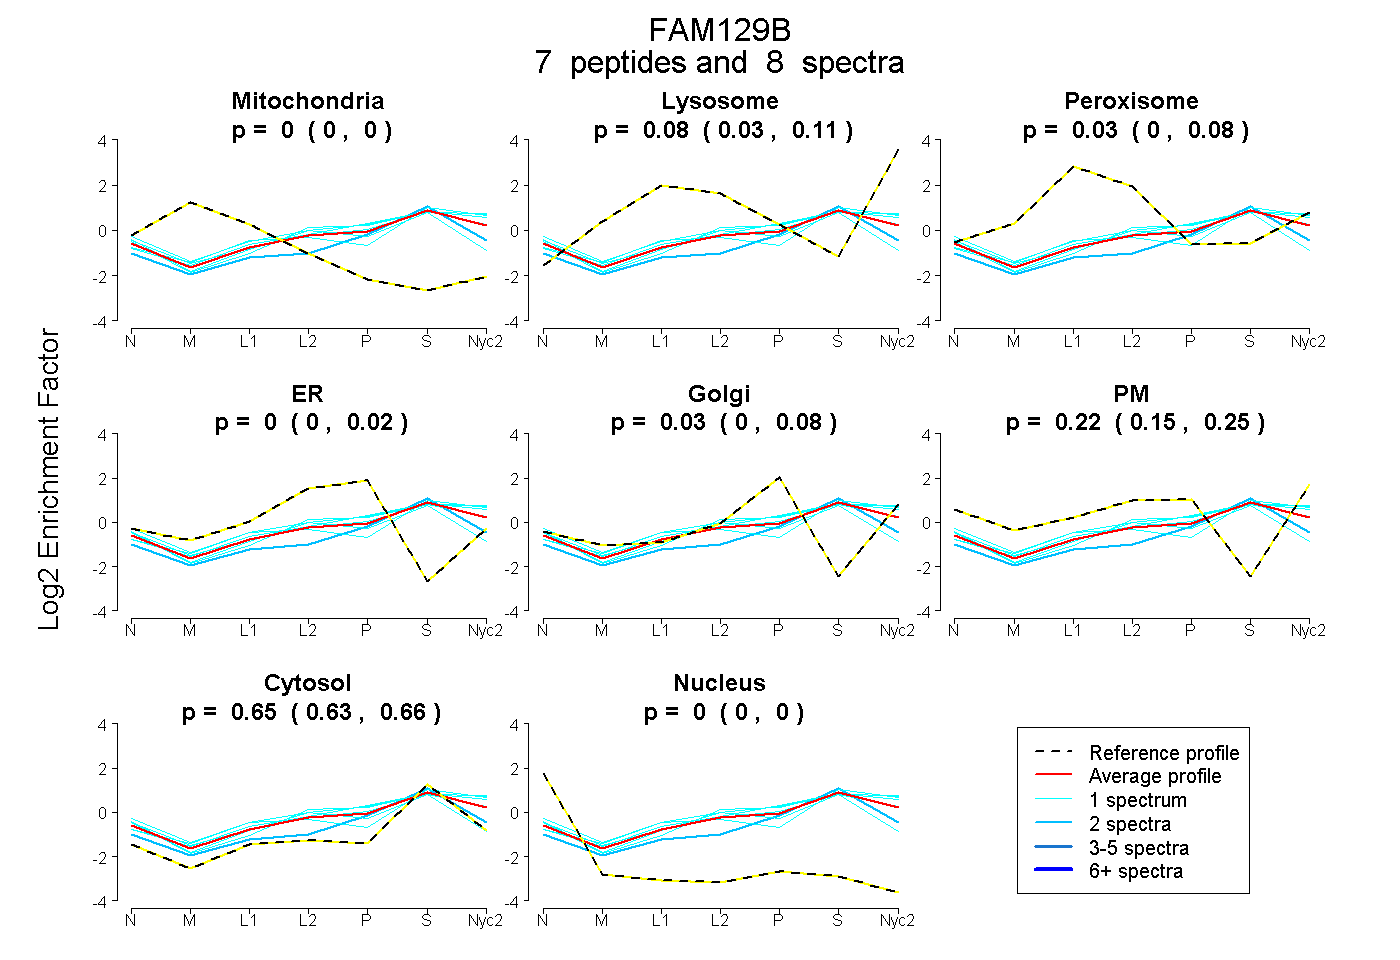
| Plot | Mito | Lyso | Perox | ER | Golgi | PM | Cytosol | Nucleus | |||||
| Expt A |
7 peptides |
8 spectra |
|
0.000 0.000 | 0.000 |
0.078 0.029 | 0.113 |
0.027 0.000 | 0.076 |
0.000 0.000 | 0.018 |
0.025 0.000 | 0.080 |
0.217 0.148 | 0.249 |
0.653 0.635 | 0.663 |
0.000 0.000 | 0.000 |
||
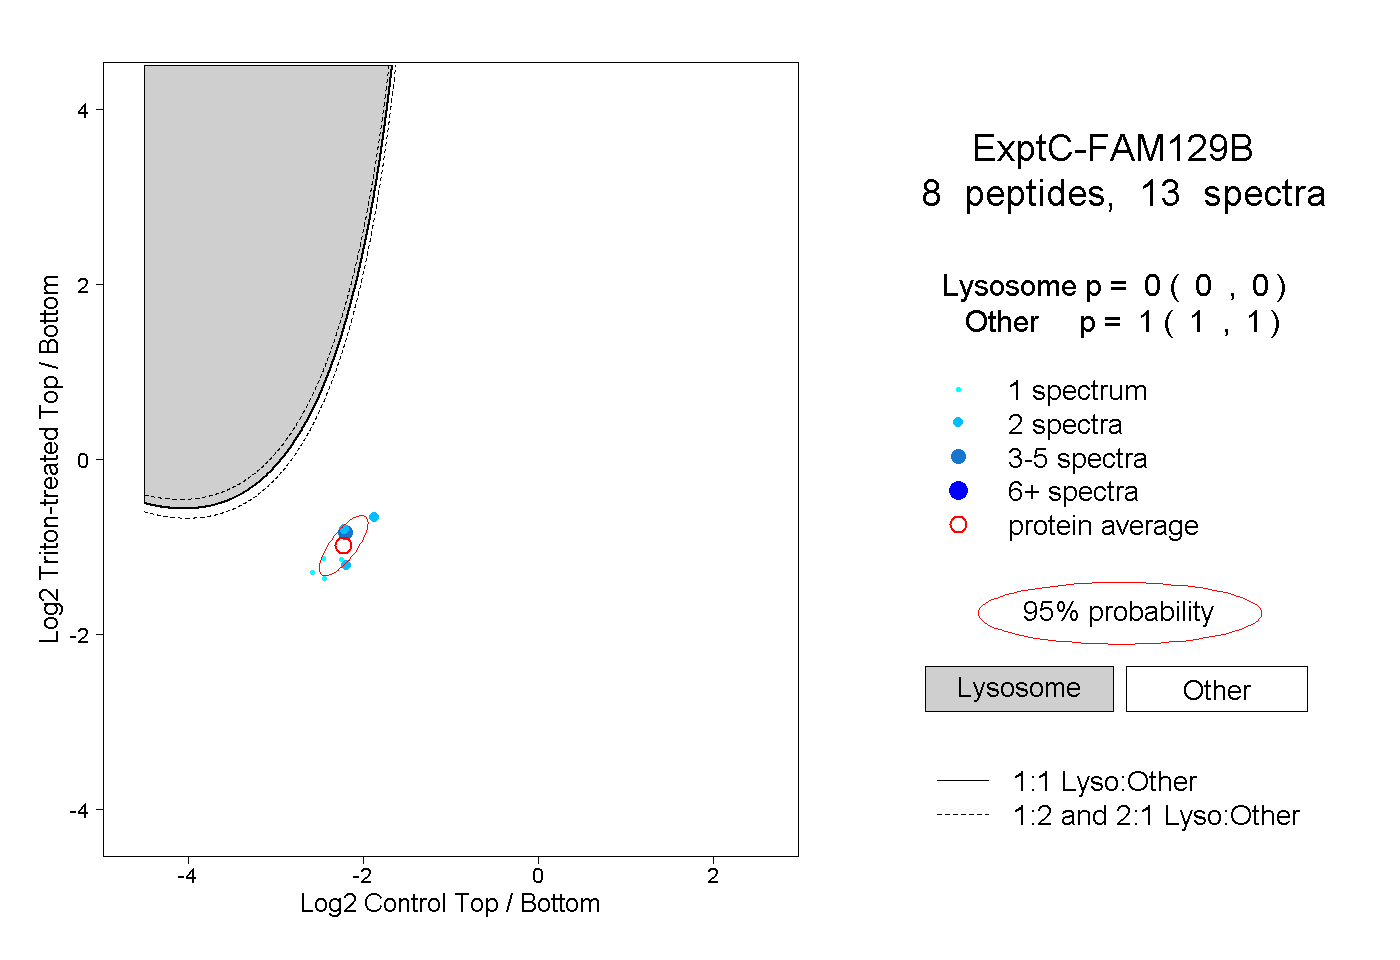
| Plot | Lyso | Other | |||||||||||
| Expt C |
8 peptides |
13 spectra |
|
0.000 0.000 | 0.000 |
1.000 1.000 | 1.000 |
| 3 spectra, MQSCYEK | 0.000 | 1.000 | ||||||||
| 2 spectra, LDGLQQR | 0.000 | 1.000 | ||||||||
| 2 spectra, VEGPAFTDAIR | 0.000 | 1.000 | ||||||||
| 1 spectrum, FDVSSTSVFK | 0.000 | 1.000 | ||||||||
| 1 spectrum, AEVCVR | 0.000 | 1.000 | ||||||||
| 1 spectrum, SGSTPILK | 0.000 | 1.000 | ||||||||
| 1 spectrum, LAPTCK | 0.000 | 1.000 | ||||||||
| 2 spectra, FQELIFEDFAR | 0.000 | 1.000 |
| Plot | Lyso | Other | |||||||||||
| Expt D |
1 peptide |
1 spectrum |
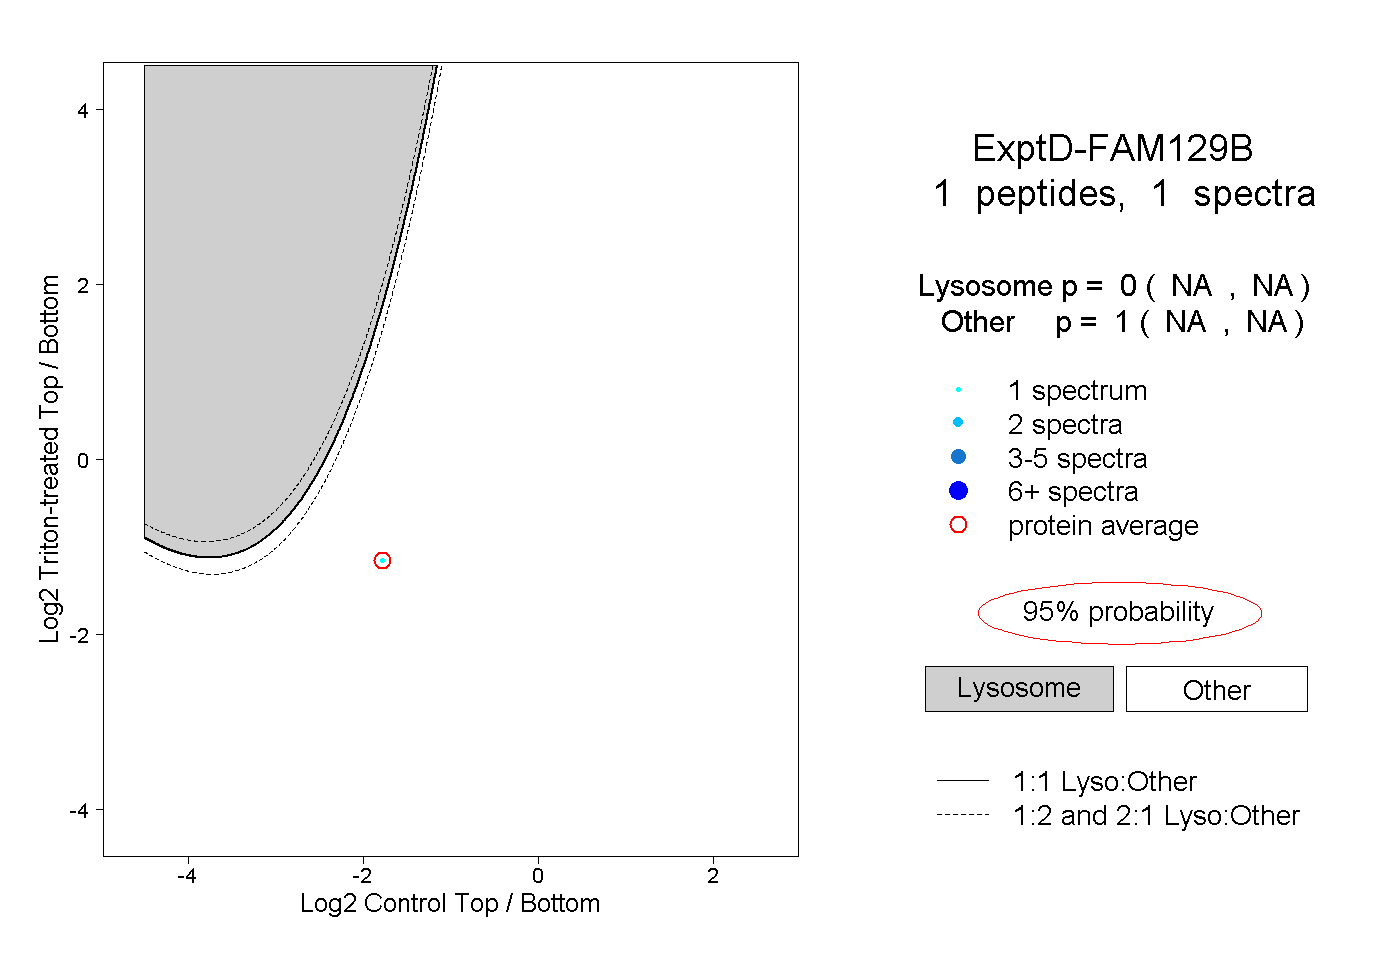 |
0.000 NA | NA |
1.000 NA | NA |