18
18peptides
spectra
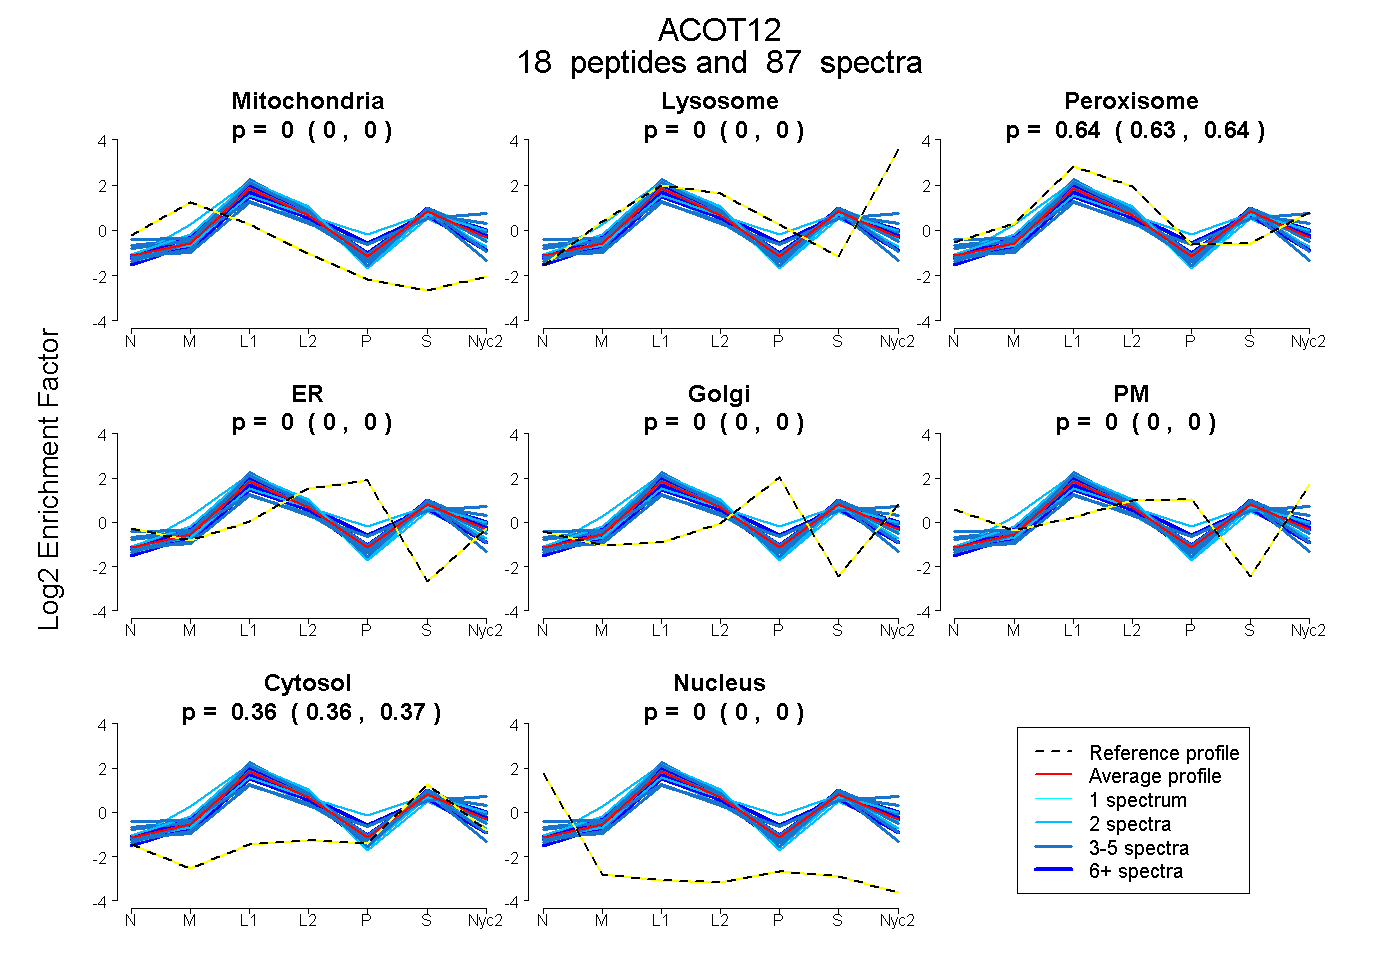
0.000 | 0.000
0.000 | 0.000
0.634 | 0.638
0.000 | 0.000
0.000 | 0.000
0.000 | 0.000
0.362 | 0.365
0.000 | 0.000
15peptides
spectra
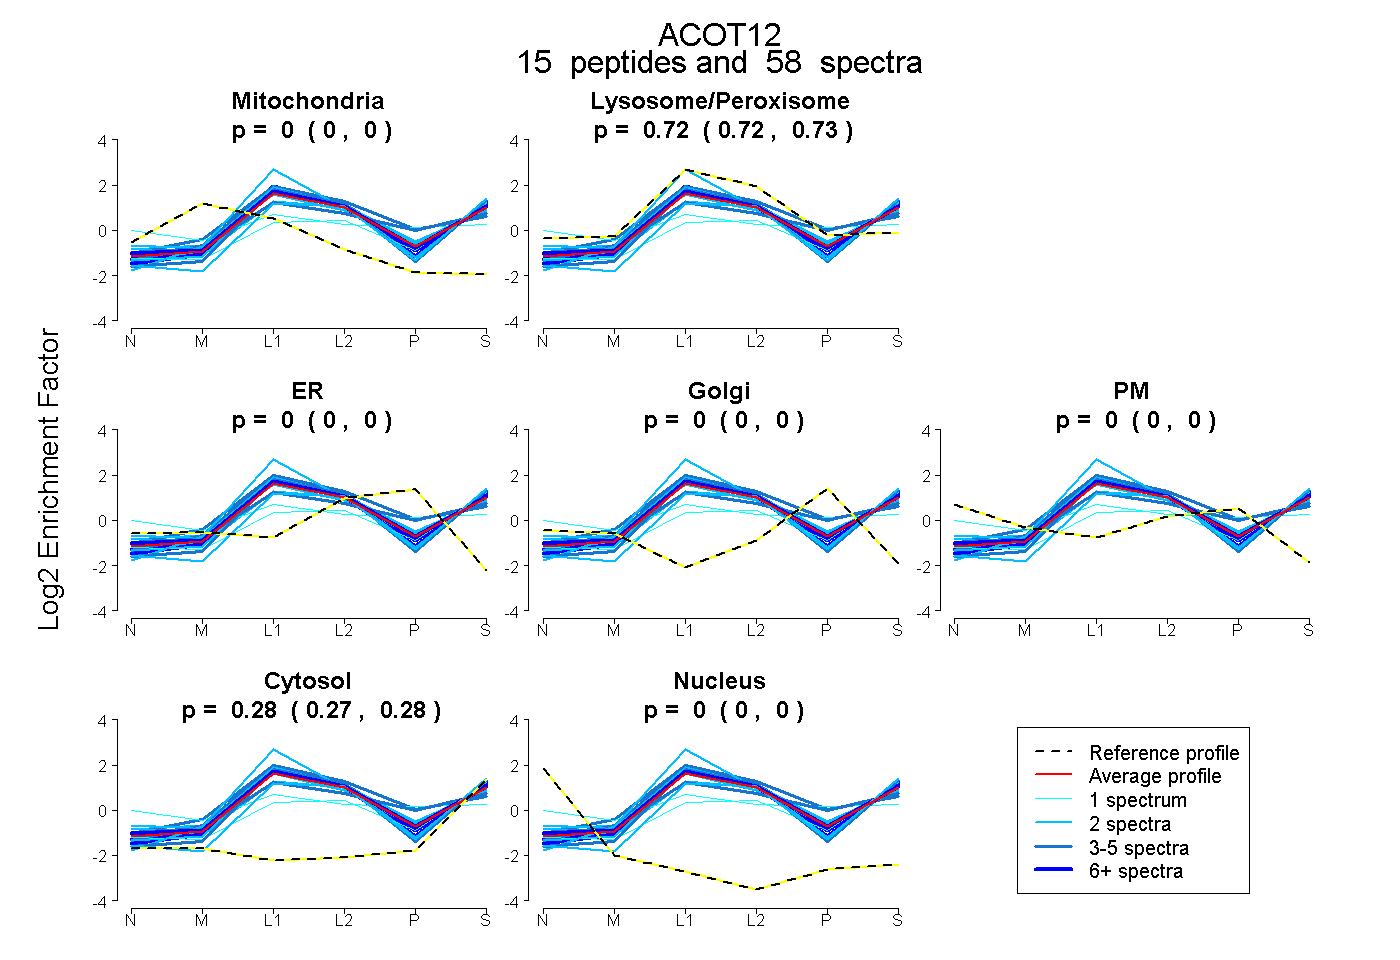
0.000 | 0.000
0.718 | 0.725
0.000 | 0.000
0.000 | 0.000
0.000 | 0.000
0.274 | 0.281
0.000 | 0.000
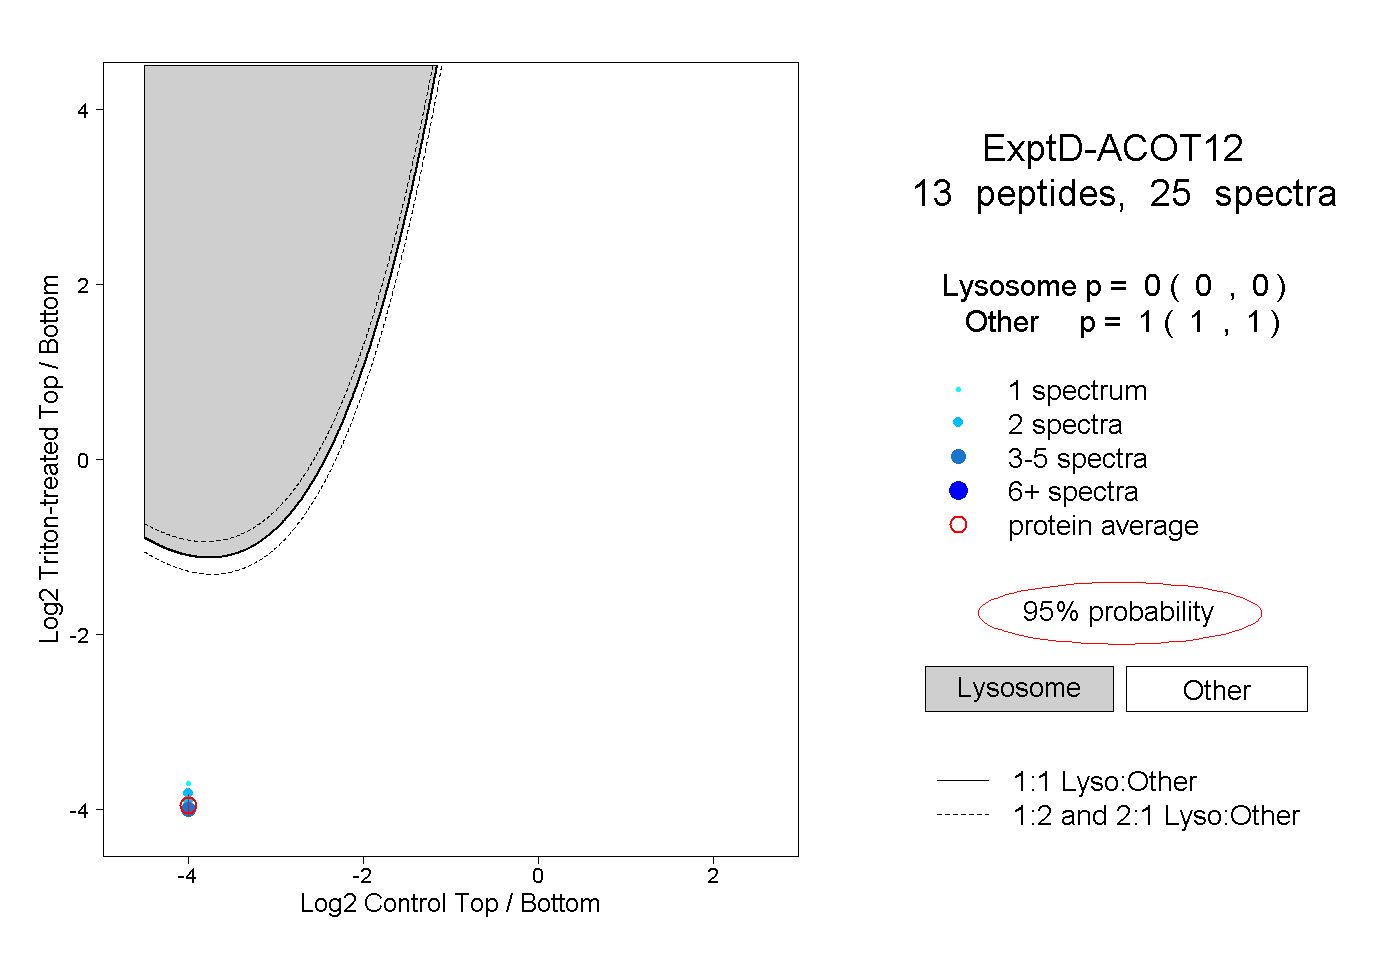
24peptides
spectra
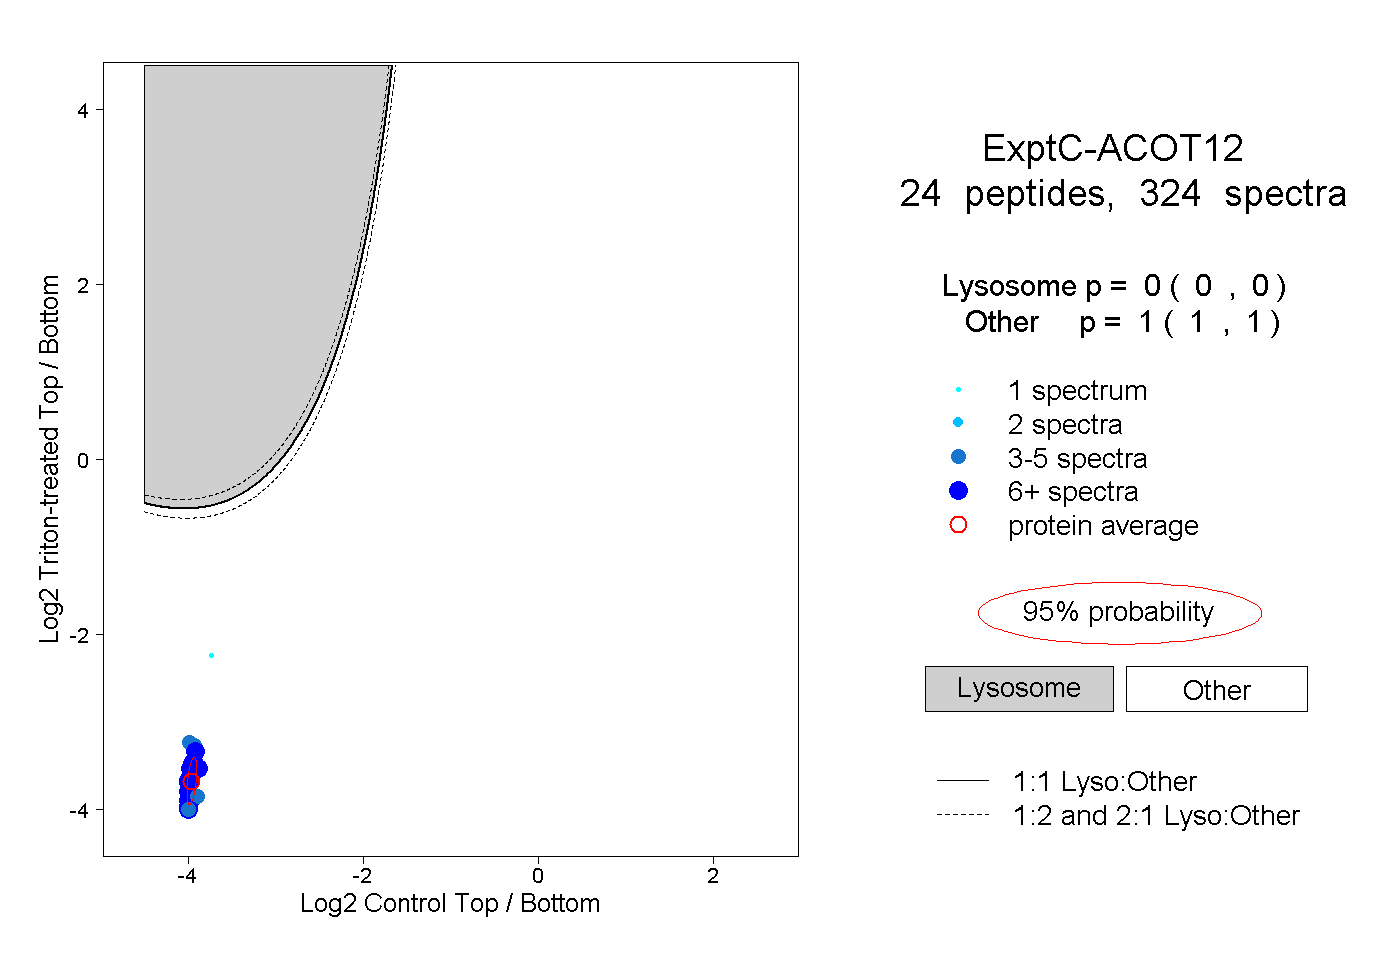
0.000 | 0.000
1.000 | 1.000