ACOT12
[ENSRNOP00000021675]
Main page
| | | Plot |
Mito |
Lyso |
|
Perox |
ER |
Golgi |
PM |
Cytosol |
Nucleus |
|
| Expt A |
 18
18
peptides |
87
spectra |
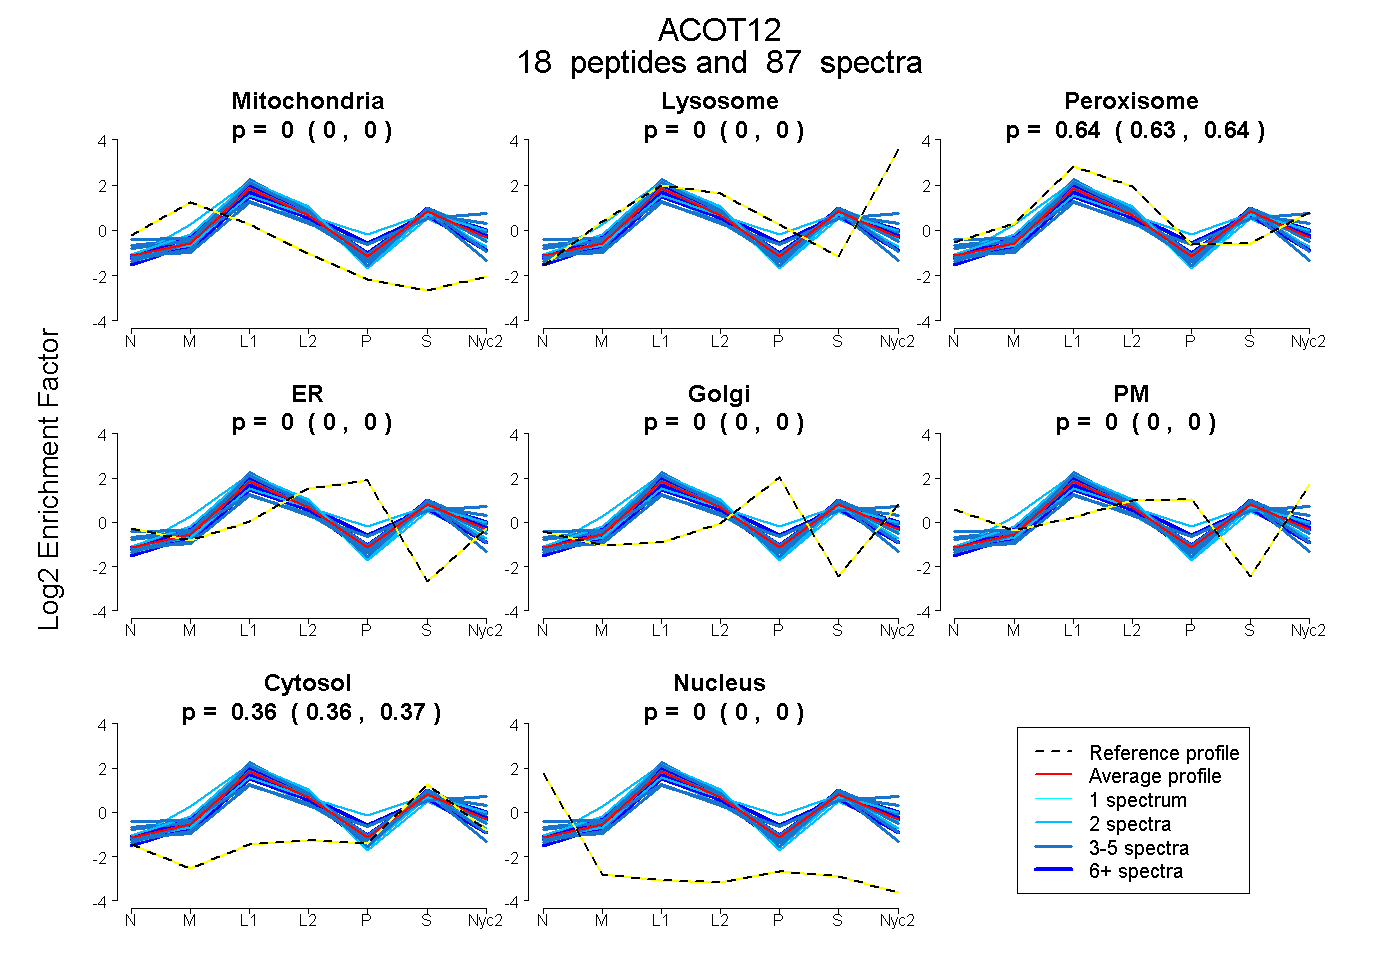 |
0.000
0.000 | 0.000 |
0.000
0.000 | 0.000 |
|
0.636
0.634 | 0.638 |
0.000
0.000 | 0.000 |
0.000
0.000 | 0.000 |
0.000
0.000 | 0.000 |
0.364
0.362 | 0.365 |
0.000
0.000 | 0.000 |
|
| | | Plot |
Mito |
|
Lyso or Perox |
|
ER |
Golgi |
PM |
Cytosol |
Nucleus |
|
| Expt B |
15
peptides |
58
spectra |
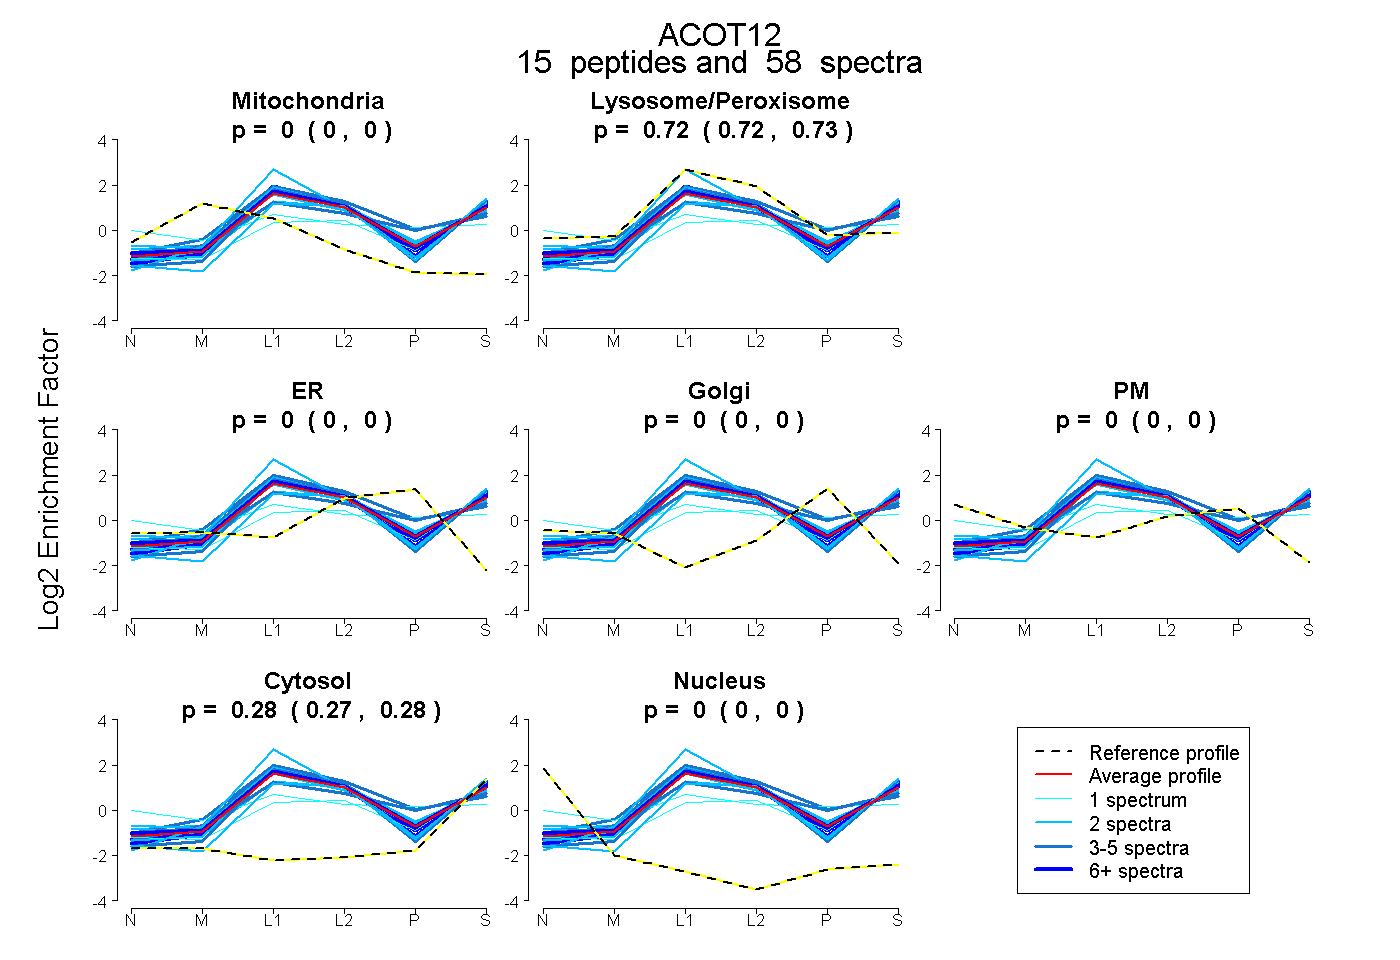 |
0.000
0.000 | 0.000 |
|
0.722
0.718 | 0.725 |
|
0.000
0.000 | 0.000 |
0.000
0.000 | 0.000 |
0.000
0.000 | 0.000 |
0.278
0.274 | 0.281 |
0.000
0.000 | 0.000 |
|
| 2 spectra, GPSTVGDR |
0.000 |
|
0.689 |
|
0.000 |
0.000 |
0.000 |
0.311 |
0.000 |
|
| 3 spectra, FIENATHDGLK |
0.000 |
|
0.834 |
|
0.000 |
0.000 |
0.000 |
0.166 |
0.000 |
|
| 1 spectrum, SVDMFK |
0.000 |
|
0.524 |
|
0.000 |
0.000 |
0.000 |
0.476 |
0.000 |
|
| 13 spectra, IGQIVTIR |
0.000 |
|
0.717 |
|
0.000 |
0.000 |
0.000 |
0.283 |
0.000 |
|
| 2 spectra, YVISHK |
0.000 |
|
0.618 |
|
0.000 |
0.000 |
0.000 |
0.382 |
0.000 |
|
| 4 spectra, VEAFDCR |
0.000 |
|
0.695 |
|
0.000 |
0.000 |
0.000 |
0.305 |
0.000 |
|
| 7 spectra, DFVVLVSQR |
0.000 |
|
0.748 |
|
0.000 |
0.000 |
0.000 |
0.252 |
0.000 |
|
| 2 spectra, EVPLGTQWDISK |
0.000 |
|
0.728 |
|
0.000 |
0.000 |
0.000 |
0.272 |
0.000 |
|
| 2 spectra, SGWEITTTLEK |
0.000 |
|
0.708 |
|
0.000 |
0.000 |
0.000 |
0.292 |
0.000 |
|
| 1 spectrum, GSISNTNVEALK |
0.000 |
|
0.510 |
|
0.000 |
0.061 |
0.216 |
0.213 |
0.000 |
|
| 2 spectra, VAYHLLSDFTK |
0.000 |
|
0.819 |
|
0.000 |
0.000 |
0.000 |
0.181 |
0.000 |
|
| 10 spectra, YQGAIAR |
0.000 |
|
0.740 |
|
0.000 |
0.000 |
0.000 |
0.260 |
0.000 |
|
| 3 spectra, SIEEAAASCIK |
0.000 |
|
0.692 |
|
0.000 |
0.022 |
0.000 |
0.286 |
0.000 |
|
| 2 spectra, QVGSPAR |
0.000 |
|
0.787 |
|
0.000 |
0.000 |
0.000 |
0.213 |
0.000 |
|
| 4 spectra, LCHGHPFLK |
0.000 |
|
0.772 |
|
0.000 |
0.000 |
0.000 |
0.228 |
0.000 |
|
| | | Plot |
|
Lyso |
|
|
|
|
|
|
|
Other |
| Expt C |
24
peptides |
324
spectra |
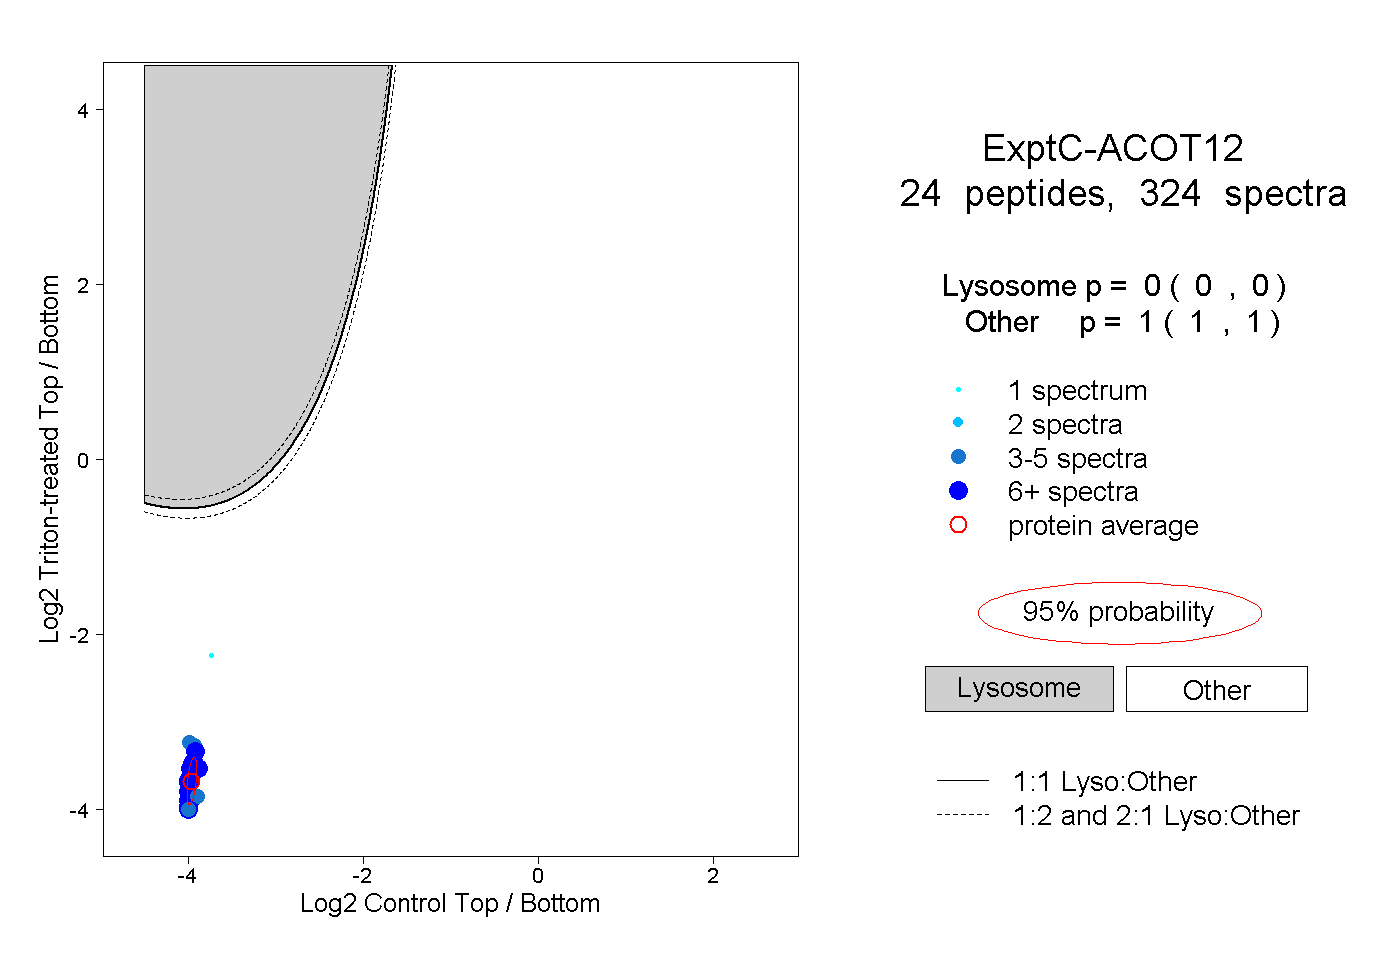 |
|
0.000
0.000 | 0.000 |
|
|
|
|
|
|
|
1.000
1.000 | 1.000 |
| | | Plot |
|
Lyso |
|
|
|
|
|
|
|
Other |
| Expt D |
13
peptides |
25
spectra |
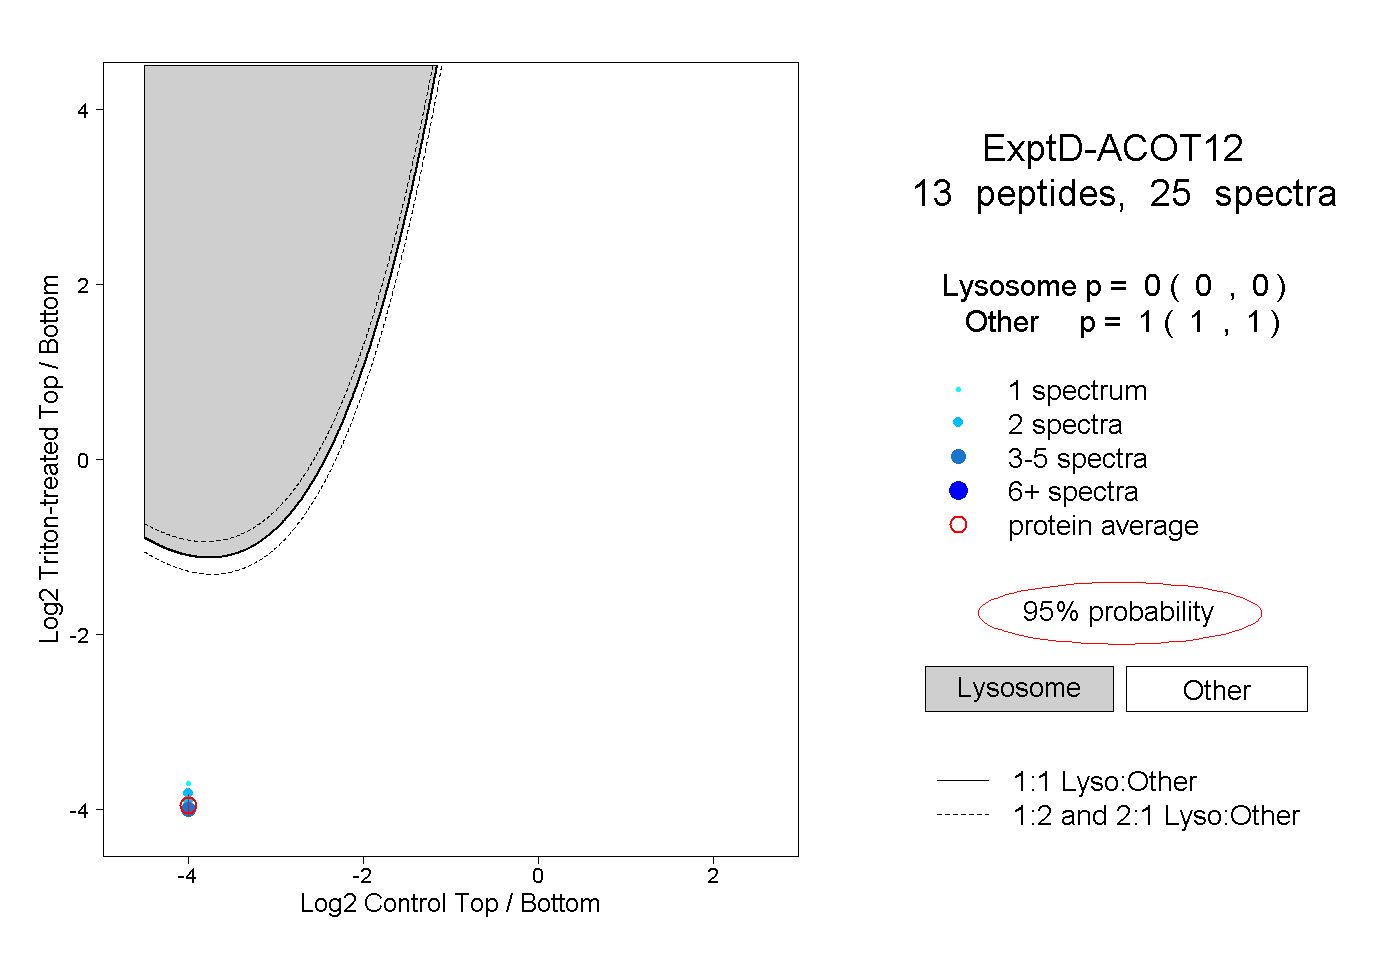 |
|
0.000
0.000 | 0.000 |
|
|
|
|
|
|
|
1.000
1.000 | 1.000 |