 17
17peptides
spectra
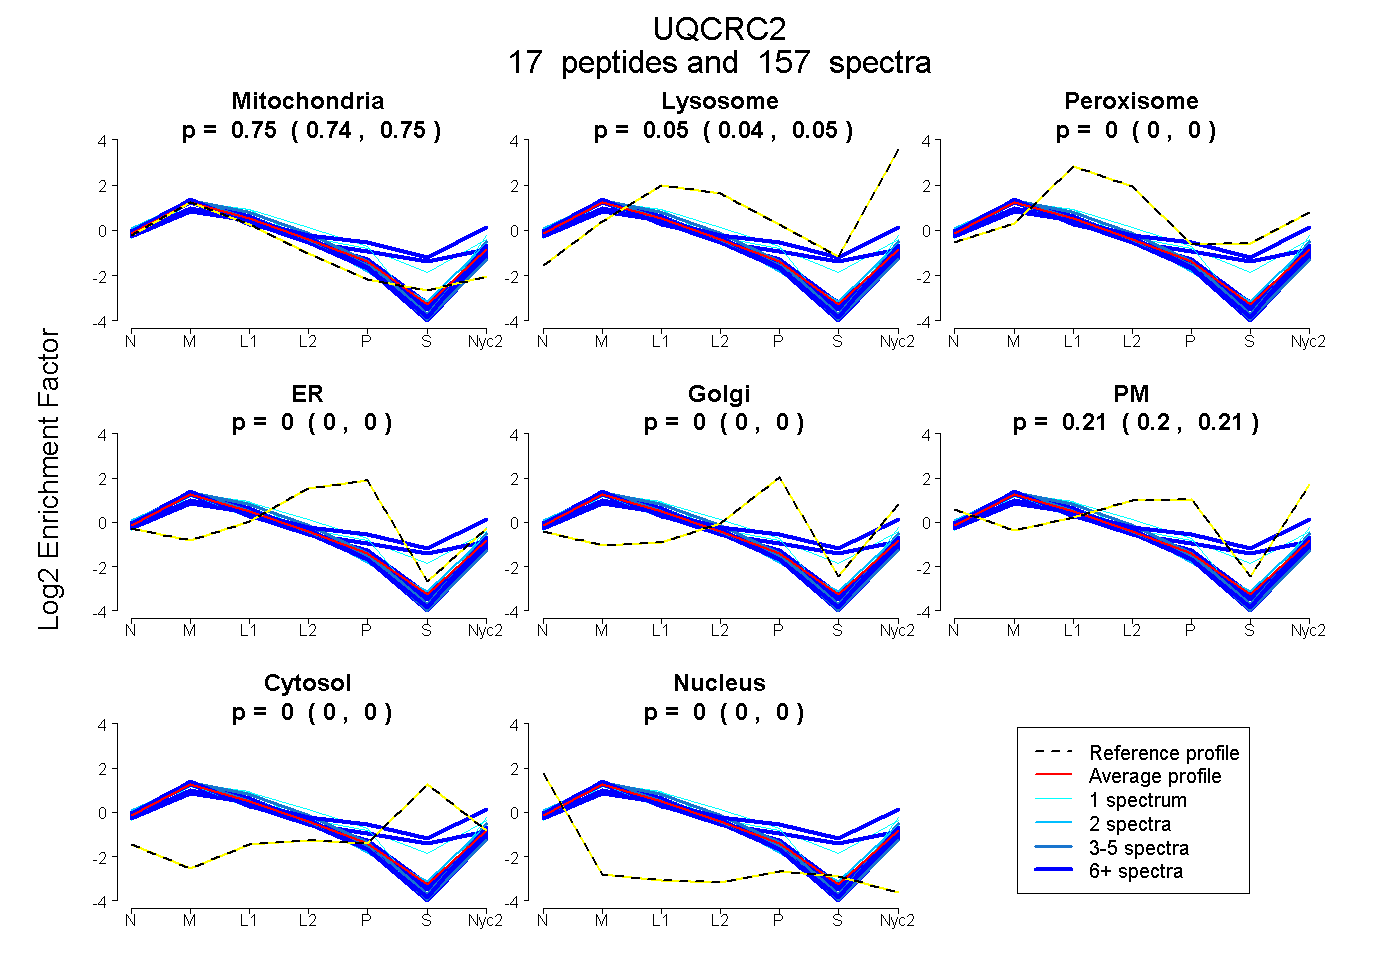
0.743 | 0.747
0.044 | 0.051
0.000 | 0.000
0.000 | 0.000
0.000 | 0.000
0.203 | 0.211
0.000 | 0.000
0.000 | 0.000
15peptides
spectra
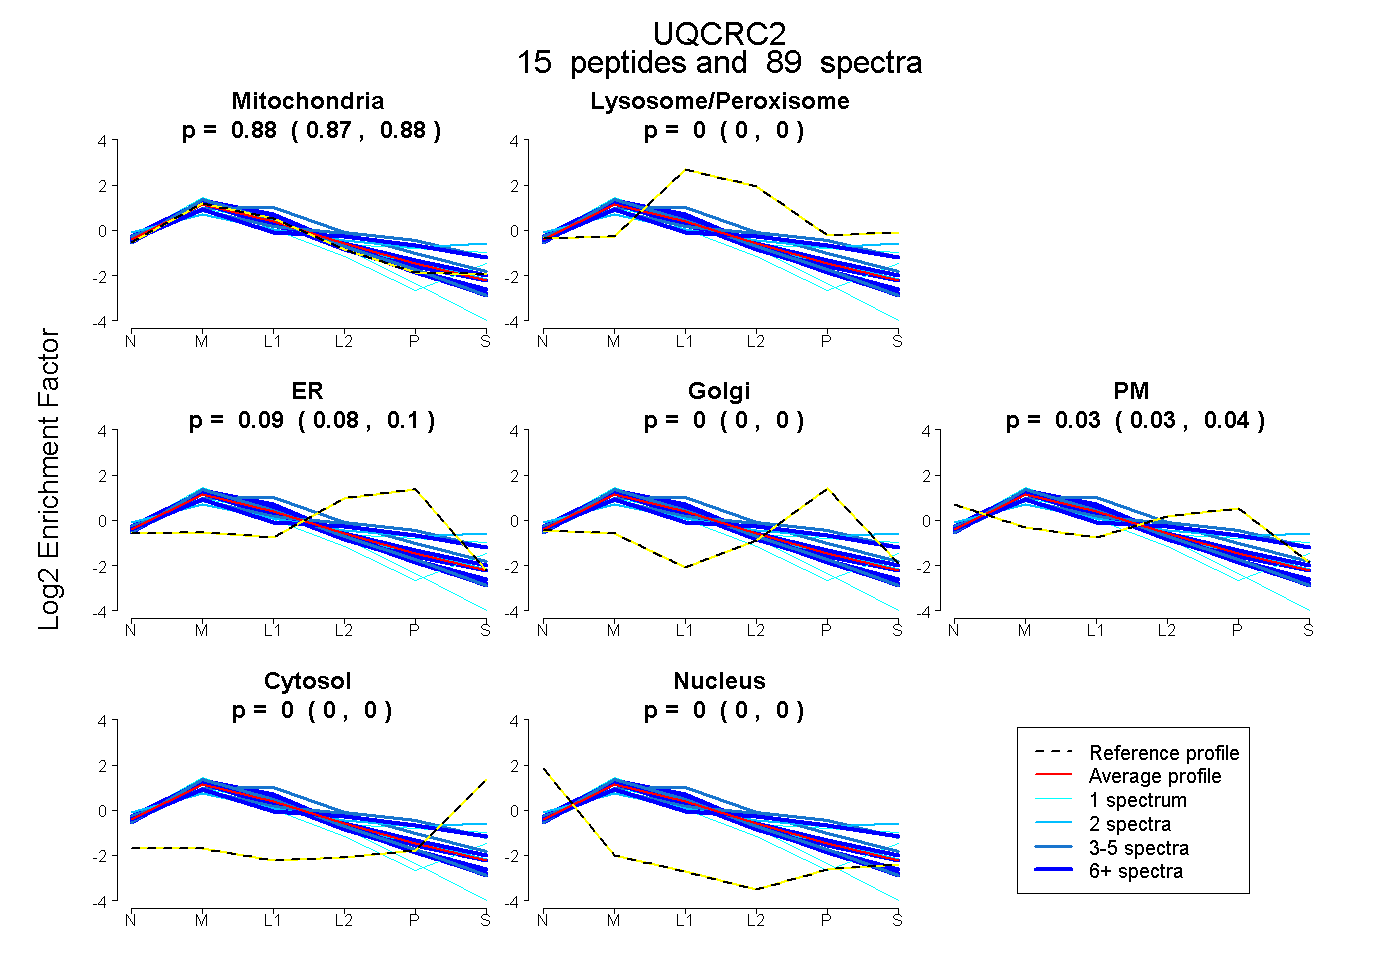
0.872 | 0.882
0.000 | 0.000
0.081 | 0.096
0.000 | 0.000
0.026 | 0.040
0.000 | 0.000
0.000 | 0.000
20peptides
spectra
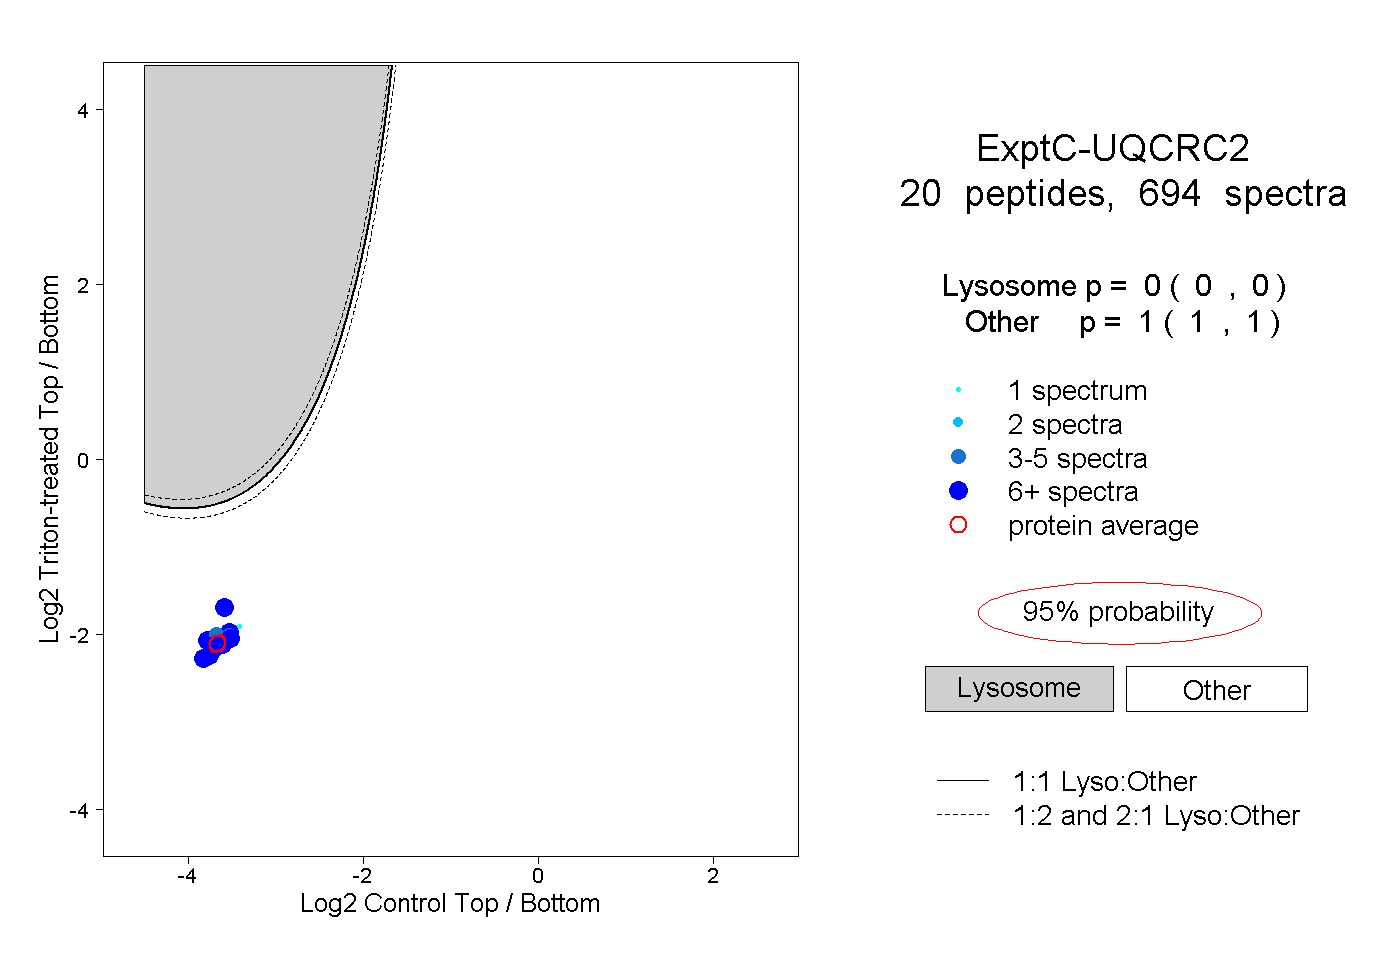
0.000 | 0.000
1.000 | 1.000
13peptides
spectra
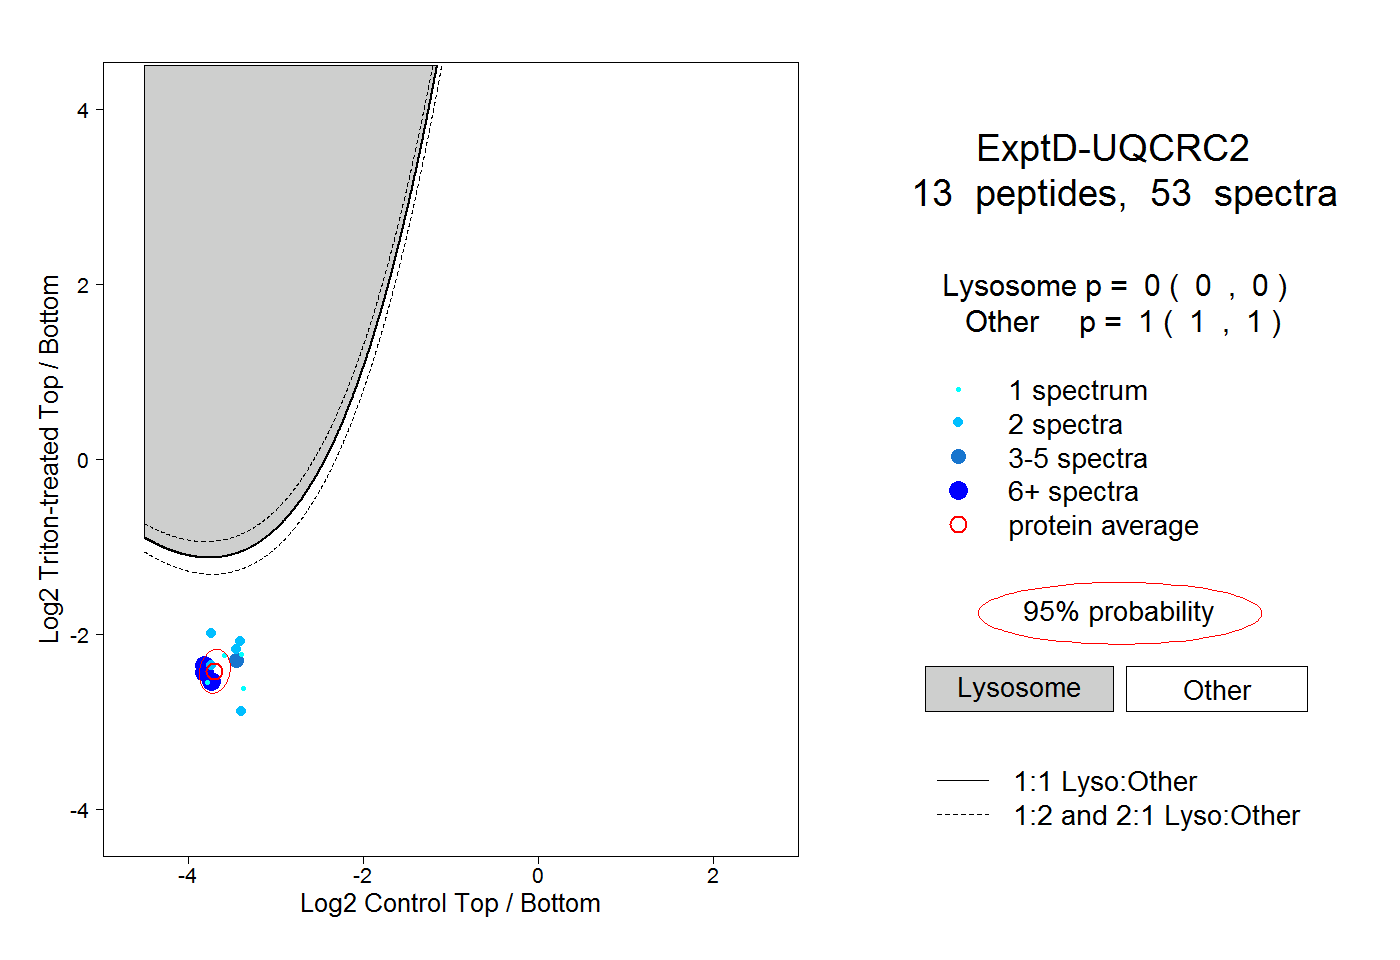
0.000 | 0.000
1.000 | 1.000