 4
4peptides
spectra
0.054 | 0.339
0.000 | 0.025
0.000 | 0.147
0.000 | 0.073
0.000 | 0.159
0.113 | 0.411
0.216 | 0.421
0.000 | 0.190
1peptide
spectrum

NA | NA
NA | NA
| Plot | Mito | Lyso | Perox | ER | Golgi | PM | Cytosol | Nucleus | |||||
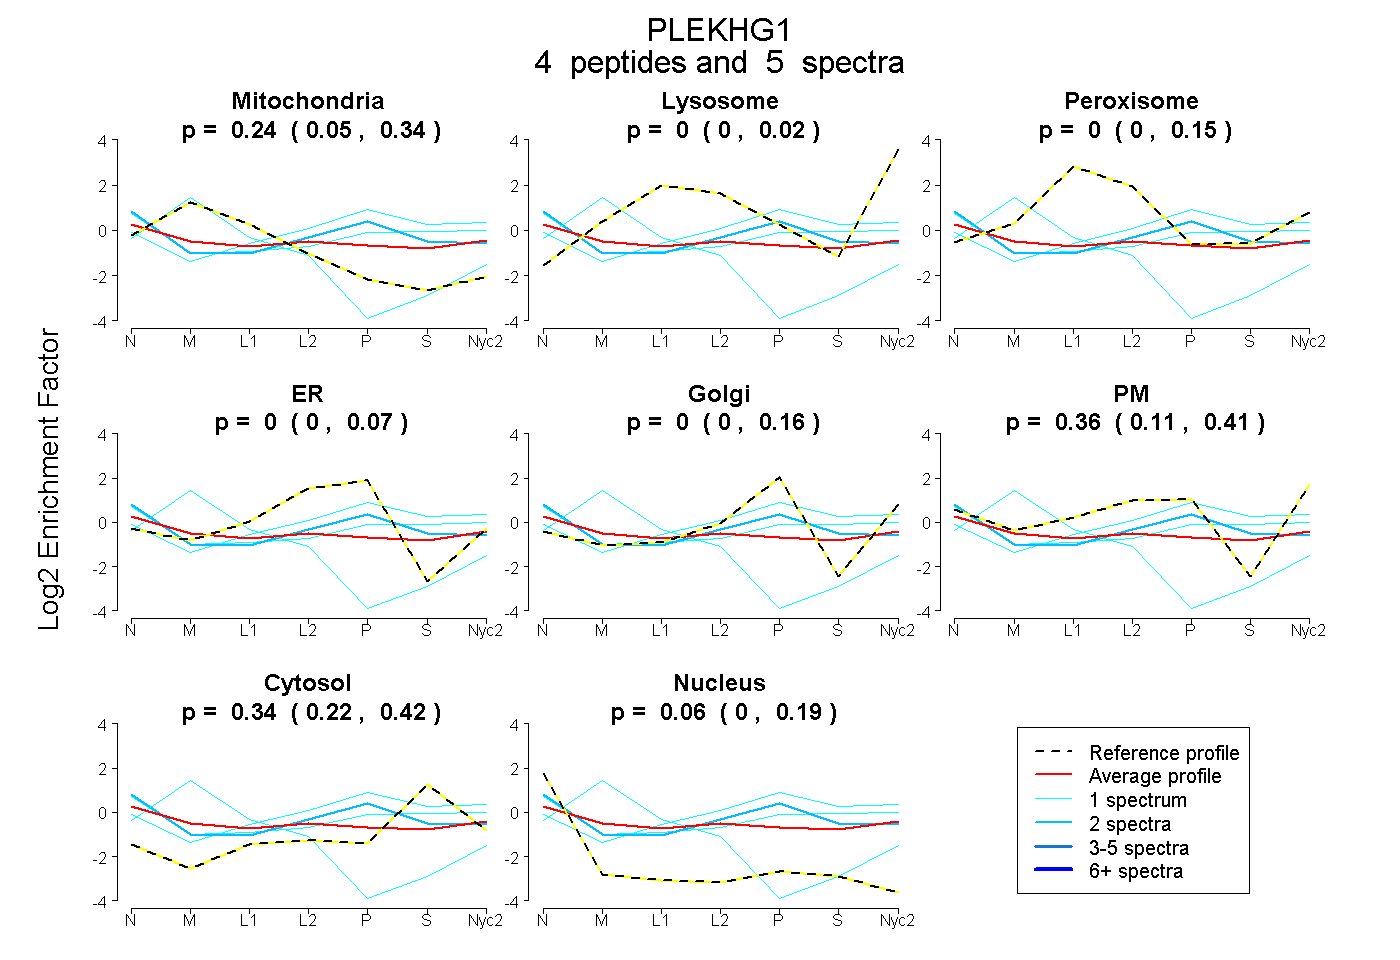
| Expt A |
4 peptides |
5 spectra |
|
0.236 0.054 | 0.339 |
0.000 0.000 | 0.025 |
0.000 0.000 | 0.147 |
0.000 0.000 | 0.073 |
0.000 0.000 | 0.159 |
0.360 0.113 | 0.411 |
0.345 0.216 | 0.421 |
0.059 0.000 | 0.190 |
||
| Plot | Lyso | Other | |||||||||||
| Expt C |
1 peptide |
1 spectrum |
|
0.000 NA | NA |
1.000 NA | NA |