 16
16peptides
spectra
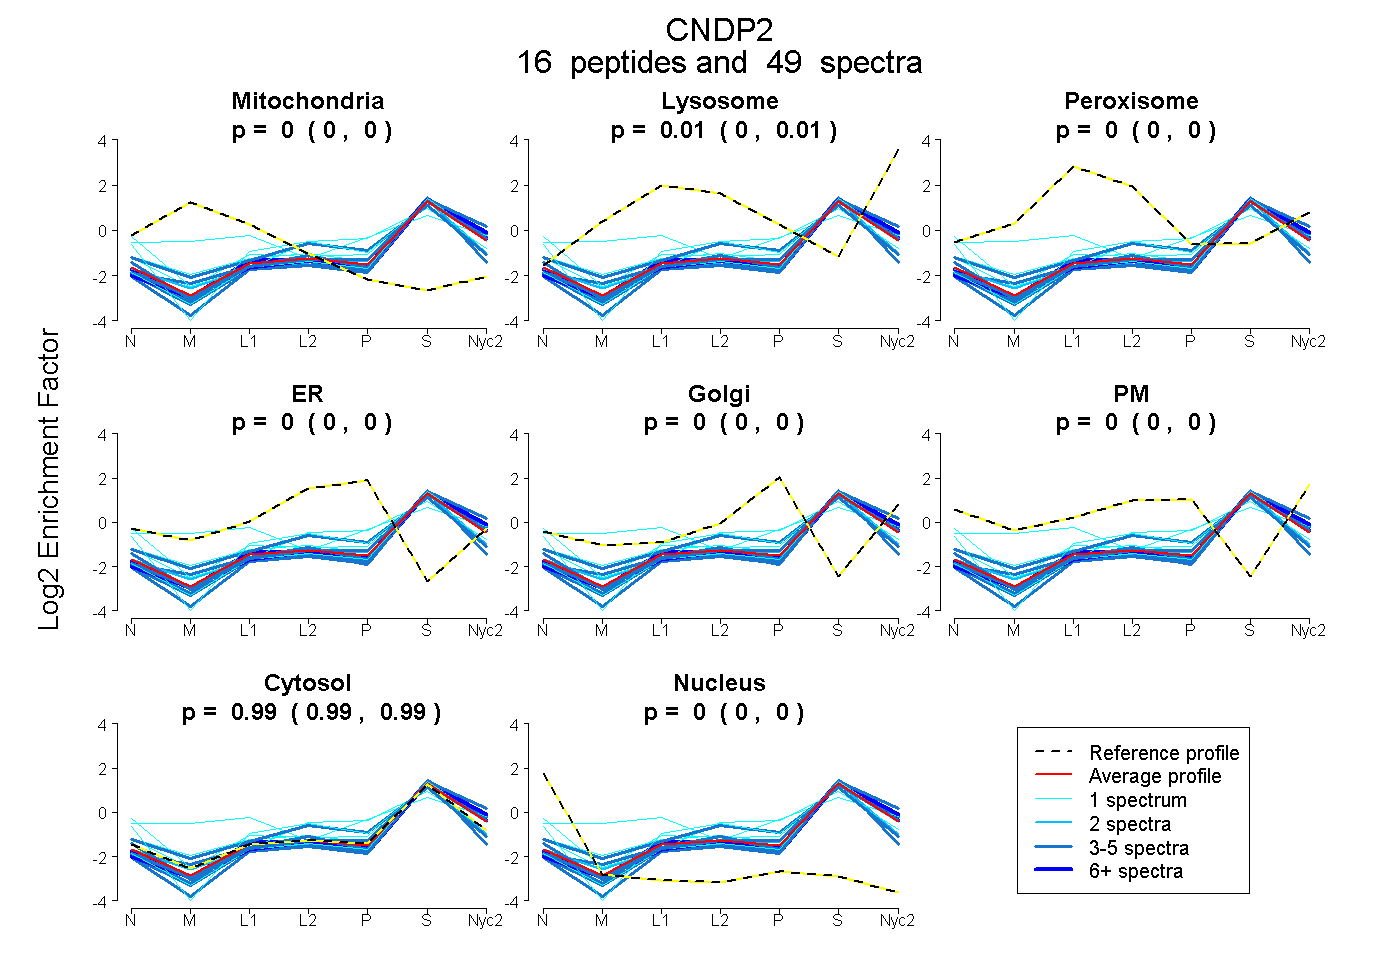
0.000 | 0.000
0.005 | 0.012
0.000 | 0.000
0.000 | 0.000
0.000 | 0.000
0.000 | 0.000
0.988 | 0.995
0.000 | 0.000
8peptides
spectra
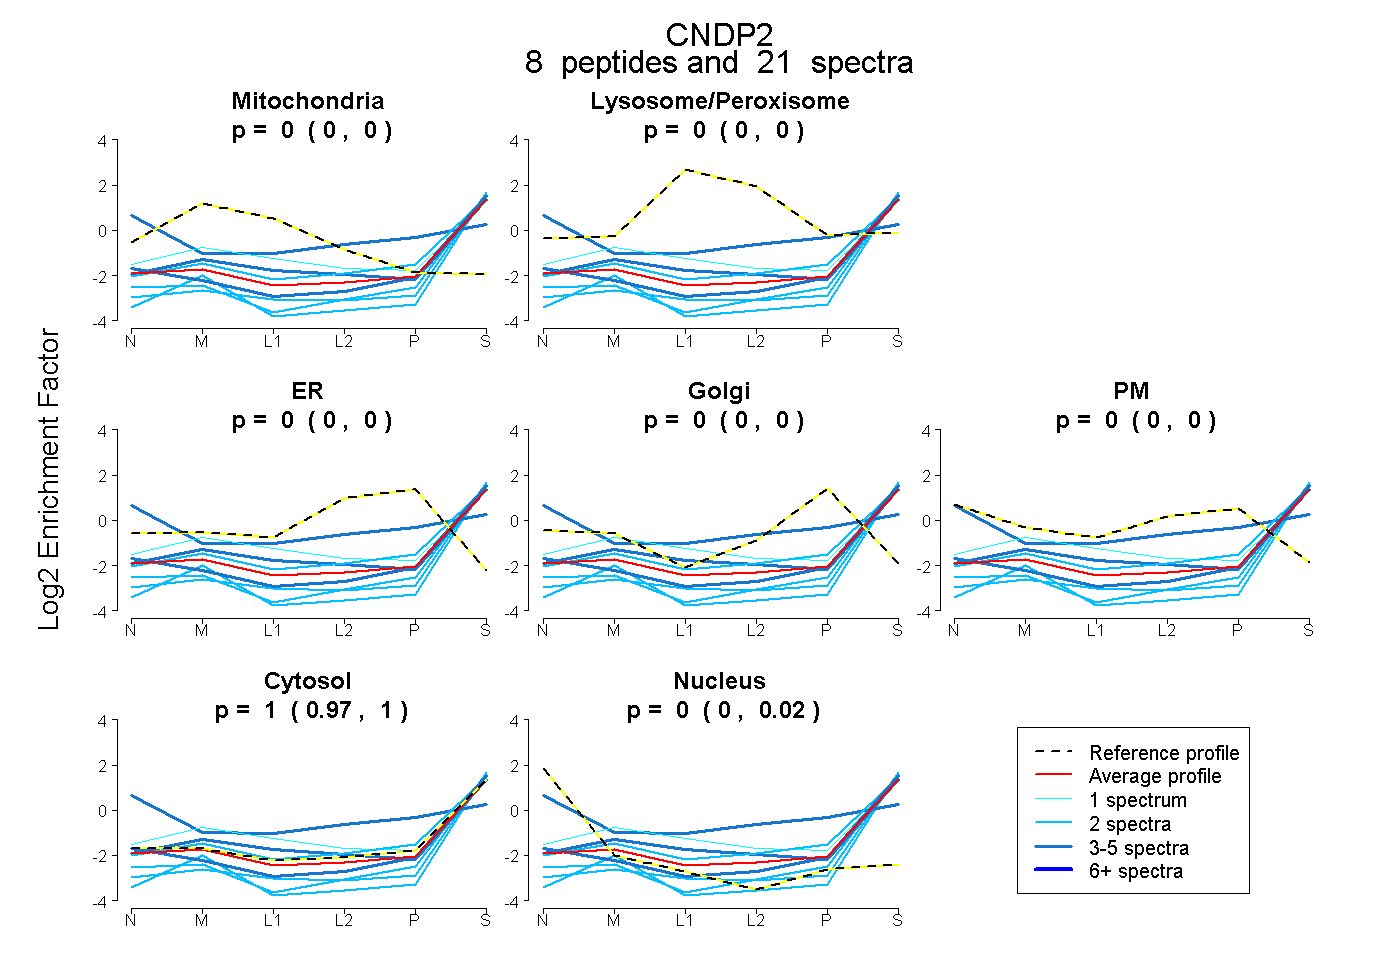
0.000 | 0.000
0.000 | 0.000
0.000 | 0.000
0.000 | 0.000
0.000 | 0.000
0.972 | 1.000
0.000 | 0.023
12peptides
spectra
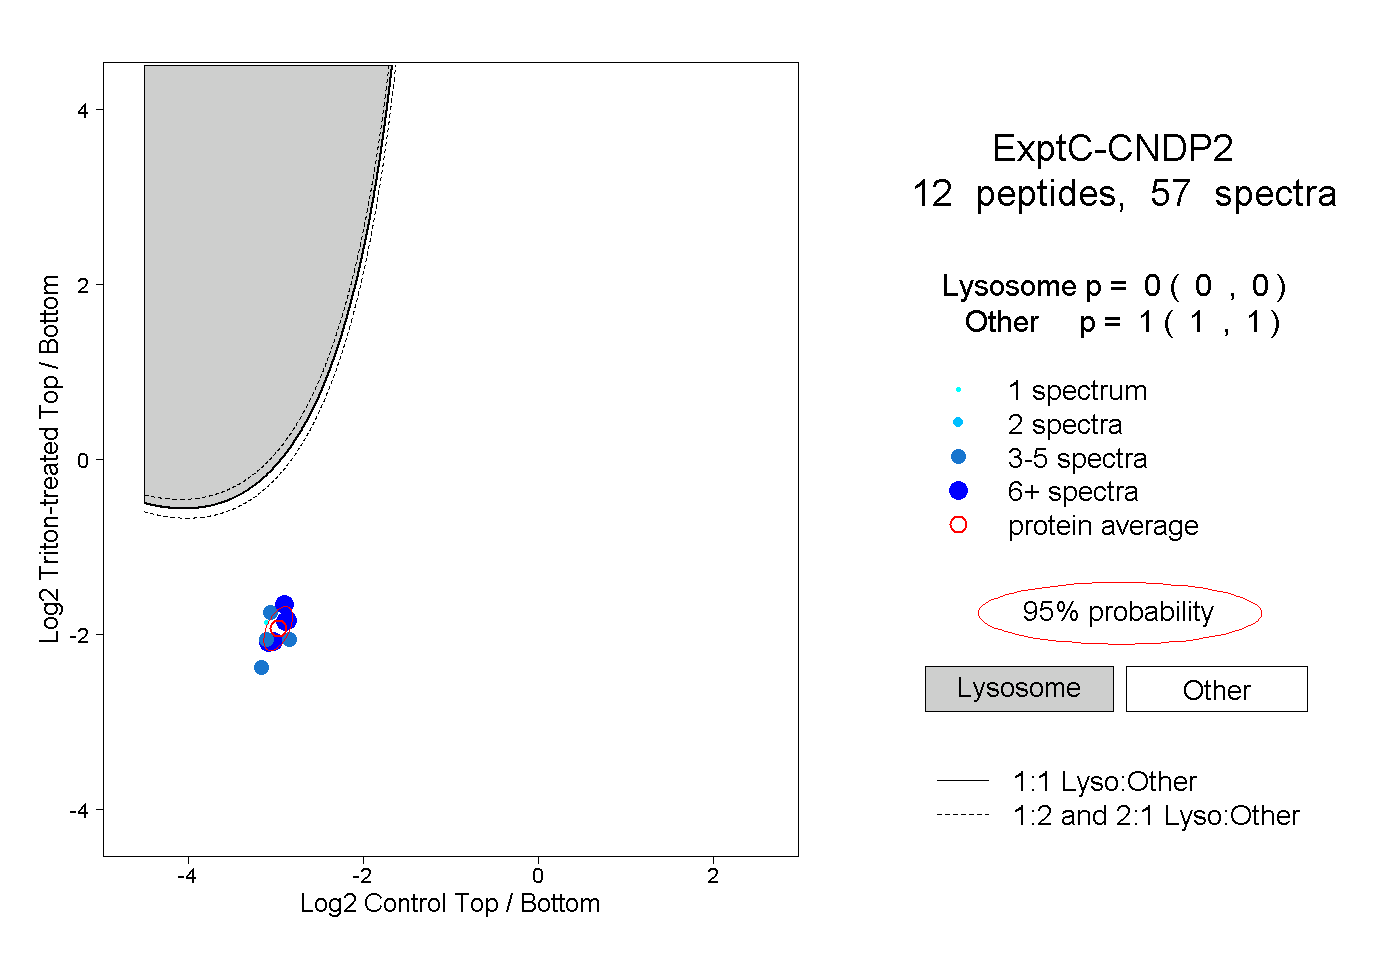
0.000 | 0.000
1.000 | 1.000
2peptides
spectra
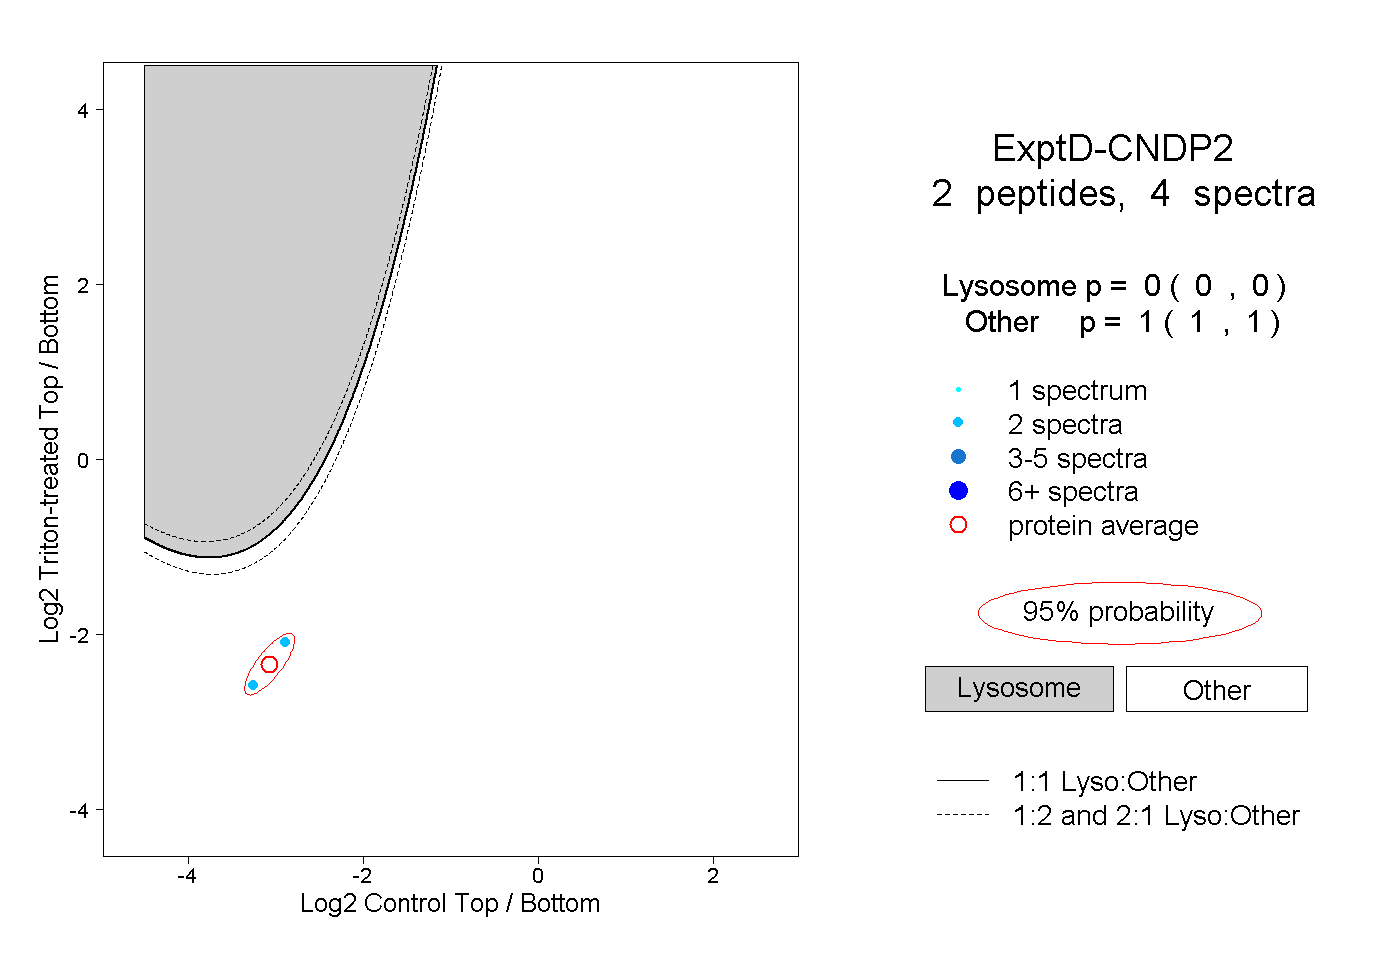
0.000 | 0.000
1.000 | 1.000