 9
9peptides
spectra
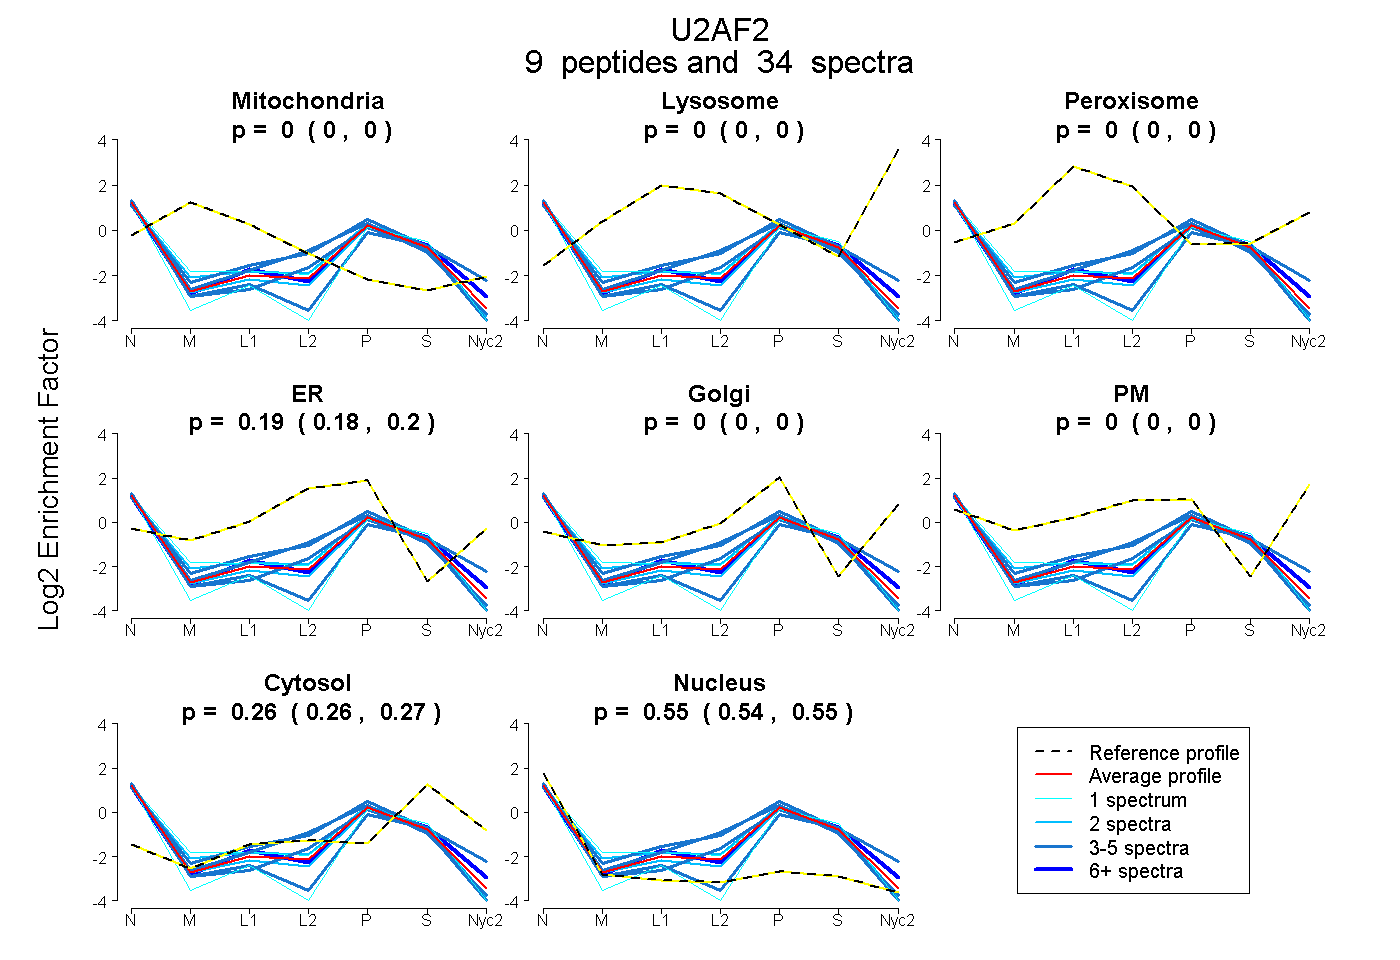
0.000 | 0.000
0.000 | 0.000
0.000 | 0.000
0.184 | 0.201
0.000 | 0.000
0.000 | 0.000
0.256 | 0.266
0.537 | 0.553
3peptides
spectra
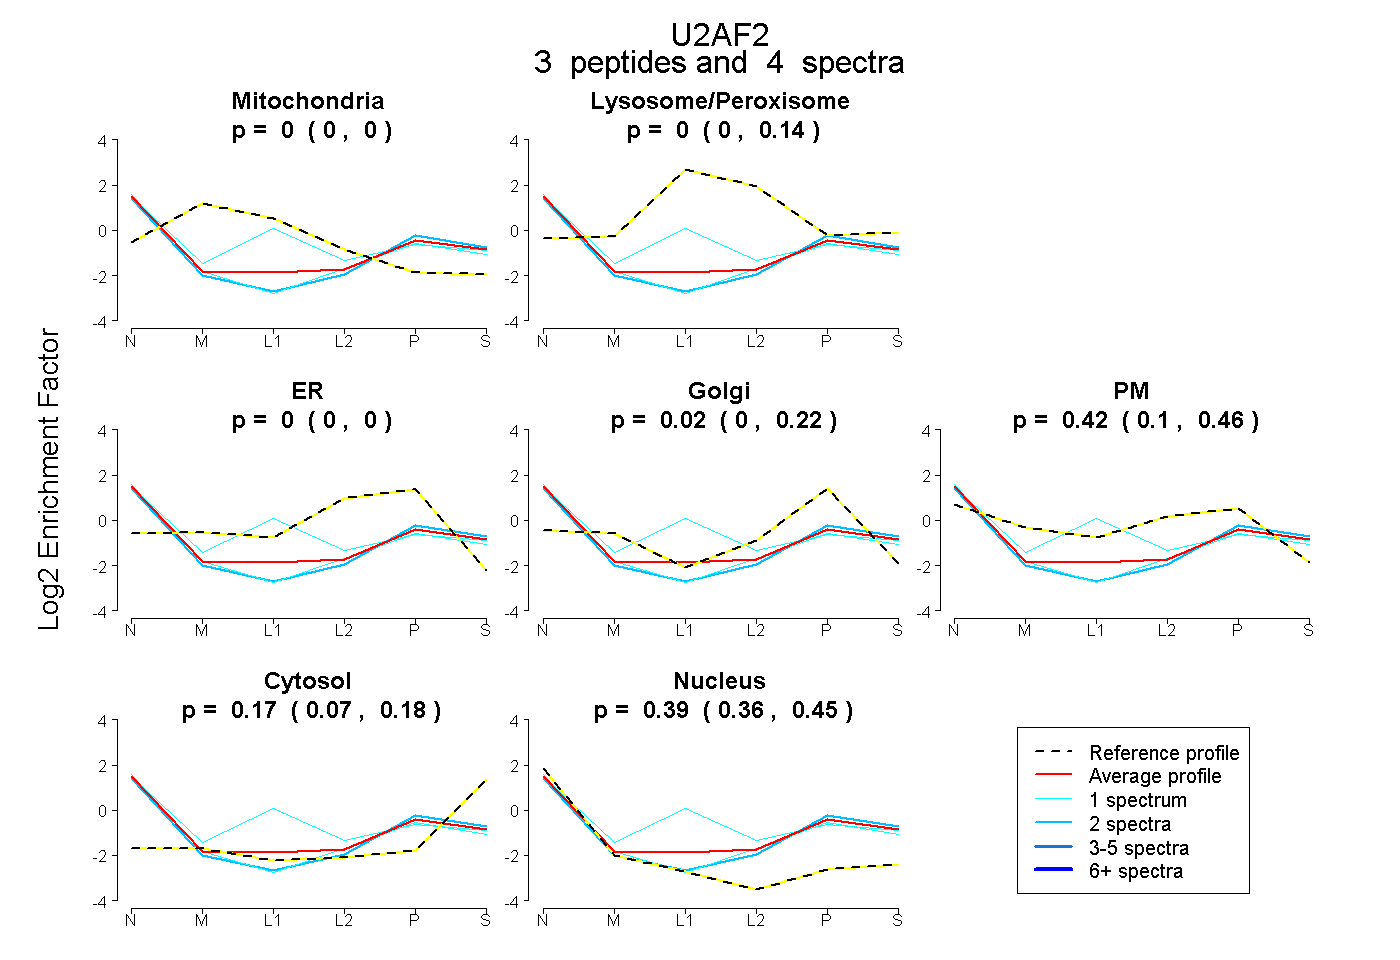
0.000 | 0.000
0.000 | 0.143
0.000 | 0.000
0.000 | 0.216
0.102 | 0.462
0.066 | 0.183
0.361 | 0.451
4peptides
spectra
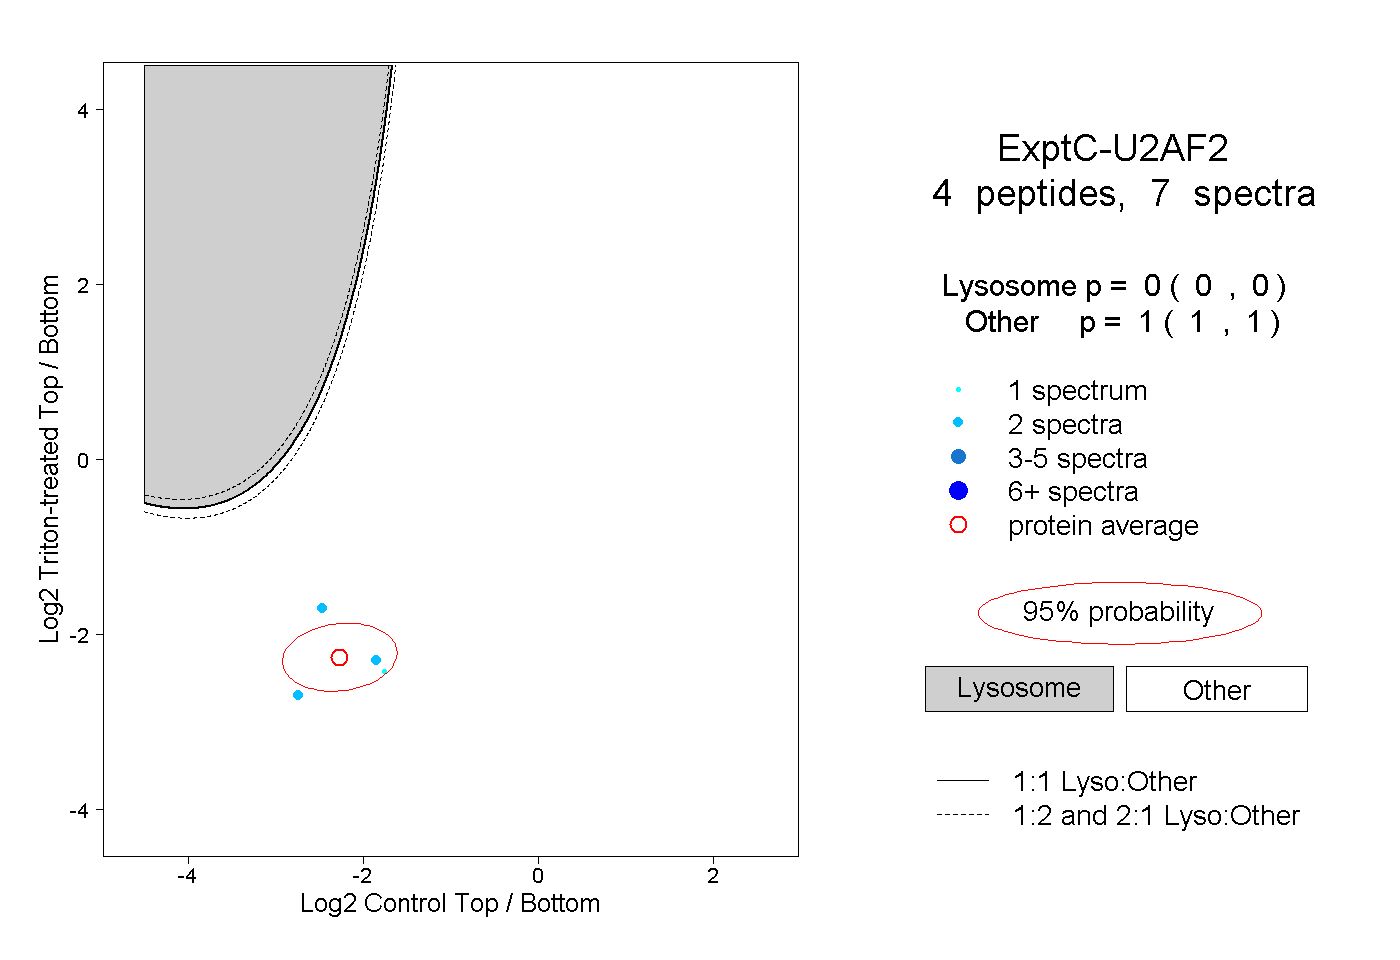
0.000 | 0.000
1.000 | 1.000