16
16peptides
spectra
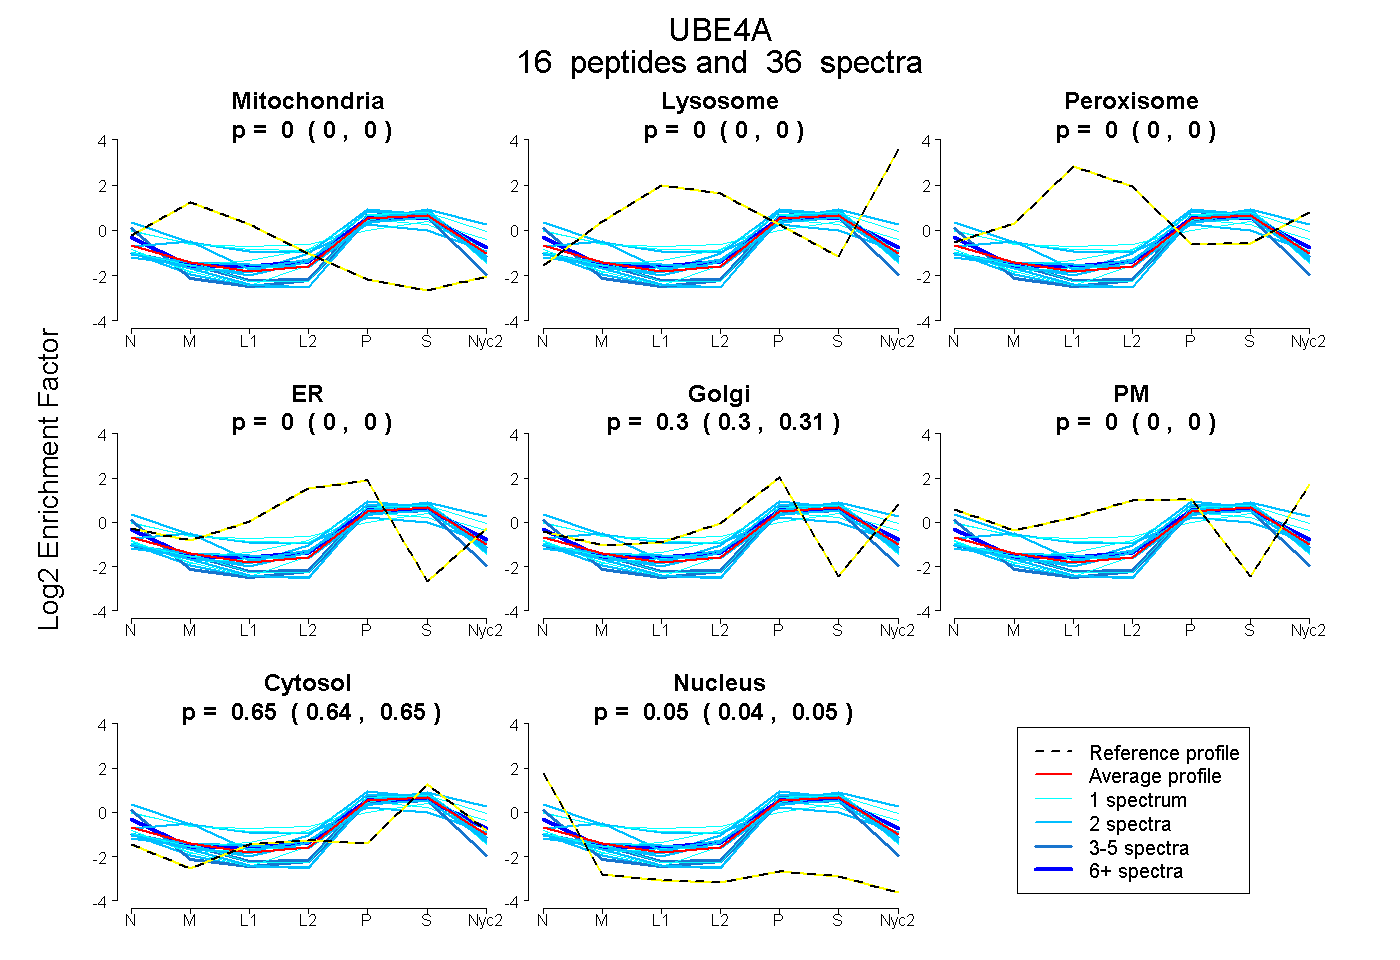
0.000 | 0.000
0.000 | 0.000
0.000 | 0.000
0.000 | 0.000
0.298 | 0.308
0.000 | 0.000
0.643 | 0.654
0.041 | 0.052
5peptides
spectra
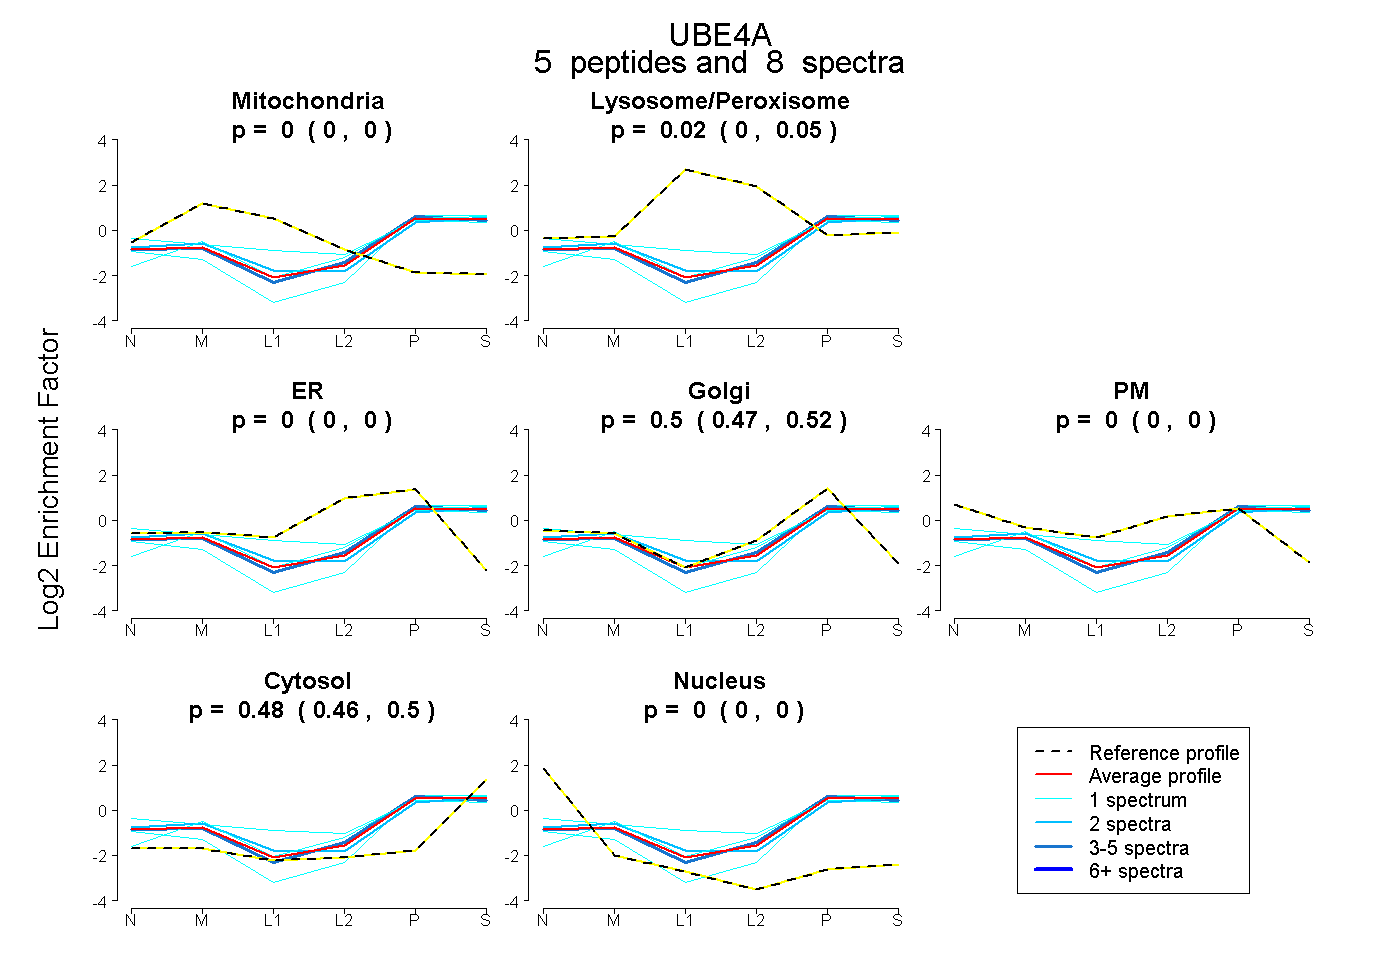
0.000 | 0.000
0.000 | 0.050
0.000 | 0.000
0.471 | 0.515
0.000 | 0.000
0.462 | 0.498
0.000 | 0.000