PYROXD2
[ENSRNOP00000021257]
Main page
| | | Plot |
Mito |
Lyso |
|
Perox |
ER |
Golgi |
PM |
Cytosol |
Nucleus |
|
| Expt A |
 17
17
peptides |
59
spectra |
 |
0.555
0.550 | 0.560 |
0.365
0.359 | 0.370 |
|
0.000
0.000 | 0.000 |
0.000
0.000 | 0.000 |
0.000
0.000 | 0.000 |
0.080
0.070 | 0.088 |
0.000
0.000 | 0.000 |
0.000
0.000 | 0.000 |
|
| | | Plot |
Mito |
|
Lyso or Perox |
|
ER |
Golgi |
PM |
Cytosol |
Nucleus |
|
| Expt B |
9
peptides |
20
spectra |
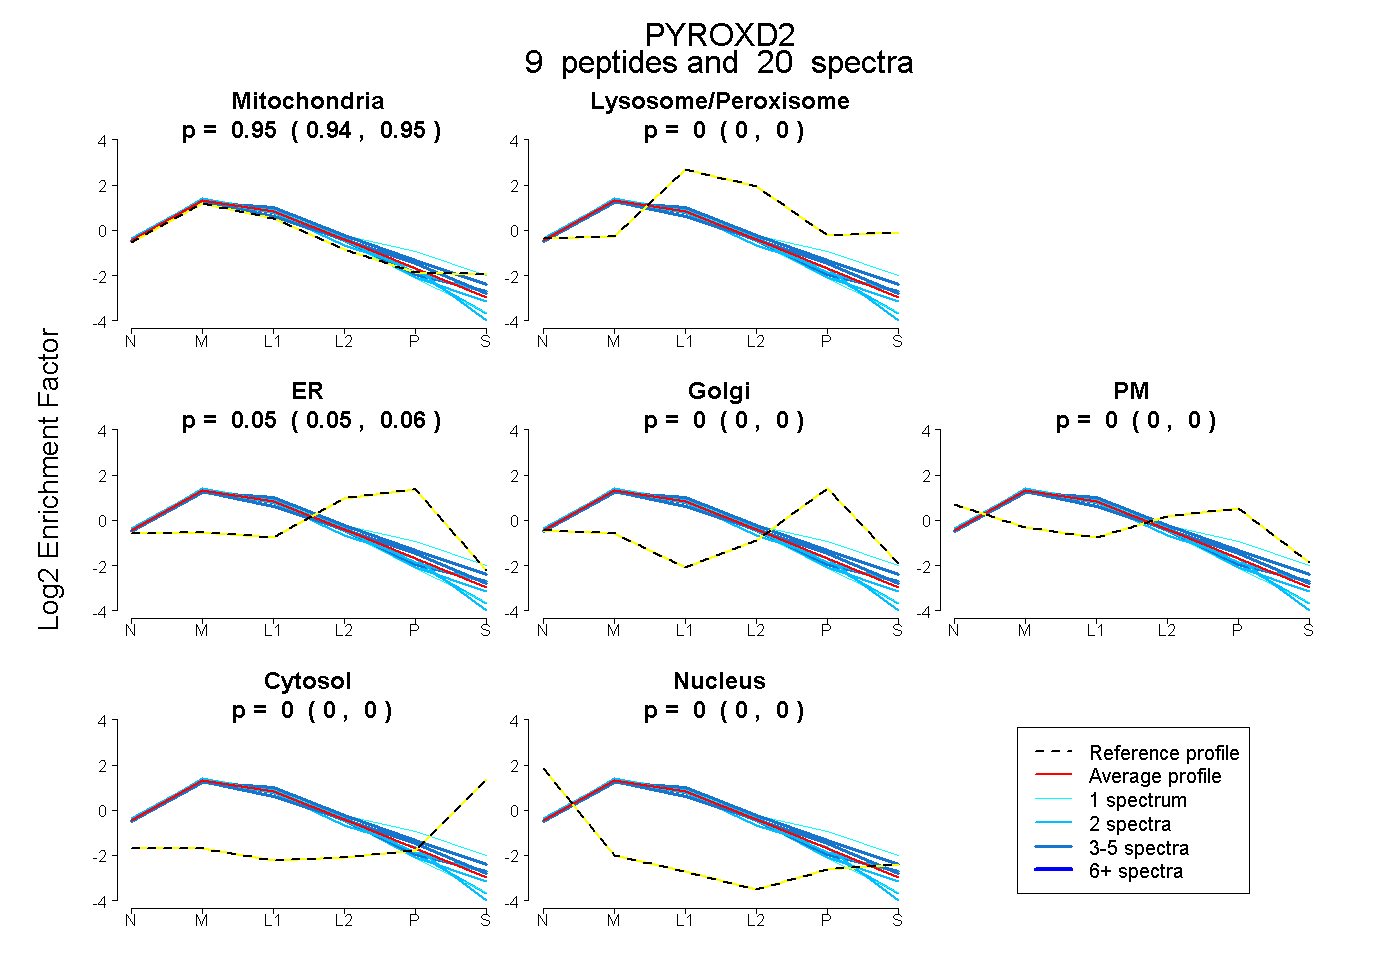 |
0.945
0.935 | 0.953 |
|
0.000
0.000 | 0.000 |
|
0.055
0.045 | 0.063 |
0.000
0.000 | 0.000 |
0.000
0.000 | 0.000 |
0.000
0.000 | 0.000 |
0.000
0.000 | 0.000 |
|
| 3 spectra, NAAHIVFR |
0.827 |
|
0.094 |
|
0.079 |
0.000 |
0.000 |
0.000 |
0.000 |
|
| 3 spectra, LGVNTAVFER |
1.000 |
|
0.000 |
|
0.000 |
0.000 |
0.000 |
0.000 |
0.000 |
|
| 1 spectrum, DILTPQDLER |
1.000 |
|
0.000 |
|
0.000 |
0.000 |
0.000 |
0.000 |
0.000 |
|
| 4 spectra, VQVNSEGR |
0.888 |
|
0.000 |
|
0.112 |
0.000 |
0.000 |
0.000 |
0.000 |
|
| 1 spectrum, DAQAFPR |
0.740 |
|
0.124 |
|
0.136 |
0.000 |
0.000 |
0.000 |
0.000 |
|
| 2 spectra, VQGVVLQGGEEVR |
0.979 |
|
0.000 |
|
0.021 |
0.000 |
0.000 |
0.000 |
0.000 |
|
| 2 spectra, QISQFSR |
0.957 |
|
0.000 |
|
0.043 |
0.000 |
0.000 |
0.000 |
0.000 |
|
| 2 spectra, ALSTLRPLLK |
0.975 |
|
0.000 |
|
0.025 |
0.000 |
0.000 |
0.000 |
0.000 |
|
| 2 spectra, INVAVDR |
1.000 |
|
0.000 |
|
0.000 |
0.000 |
0.000 |
0.000 |
0.000 |
|
| | | Plot |
|
Lyso |
|
|
|
|
|
|
|
Other |
| Expt C |
18
peptides |
241
spectra |
 |
|
0.000
0.000 | 0.000 |
|
|
|
|
|
|
|
1.000
1.000 | 1.000 |
| | | Plot |
|
Lyso |
|
|
|
|
|
|
|
Other |
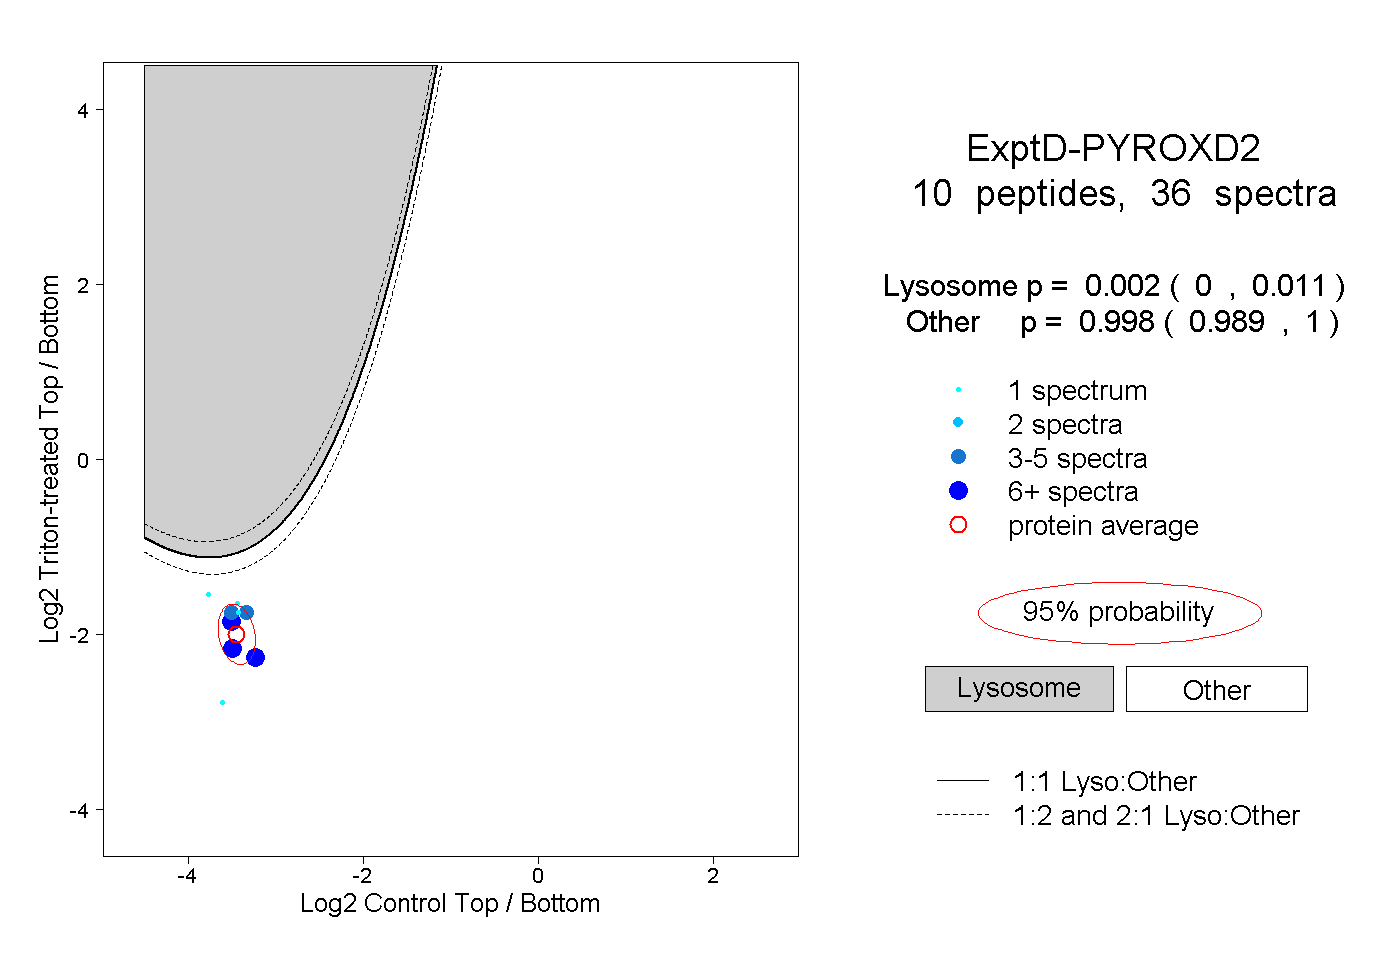
| Expt D |
10
peptides |
36
spectra |
 |
|
0.002
0.000 | 0.011 |
|
|
|
|
|
|
|
0.998
0.989 | 1.000 |