17
17peptides
spectra

0.550 | 0.560
0.359 | 0.370
0.000 | 0.000
0.000 | 0.000
0.000 | 0.000
0.070 | 0.088
0.000 | 0.000
0.000 | 0.000
9peptides
spectra
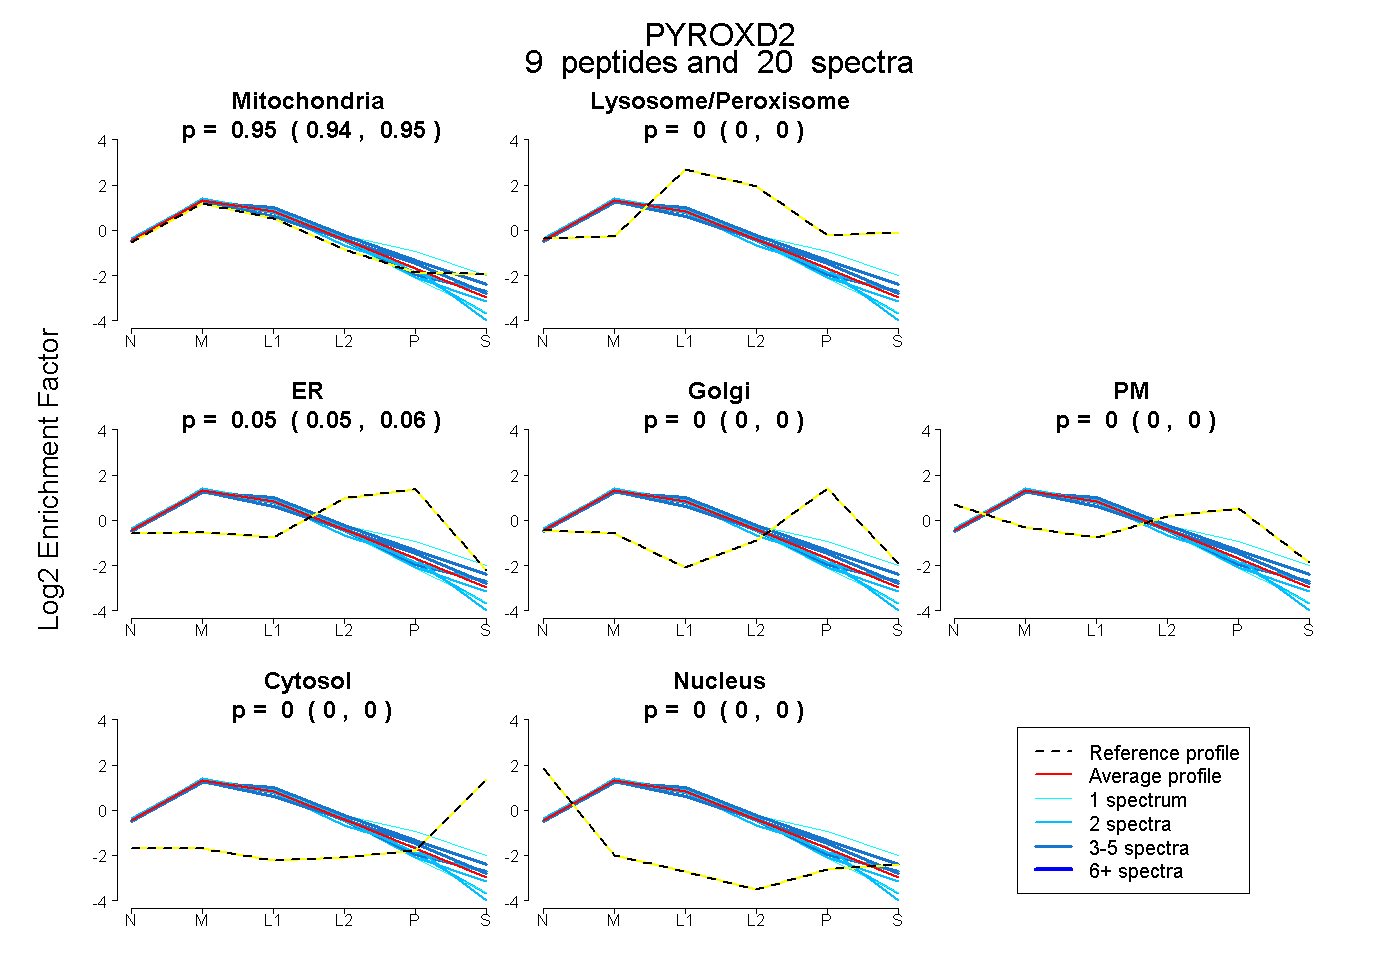
0.935 | 0.953
0.000 | 0.000
0.045 | 0.063
0.000 | 0.000
0.000 | 0.000
0.000 | 0.000
0.000 | 0.000
18peptides
spectra

0.000 | 0.000
1.000 | 1.000