24
24peptides
spectra
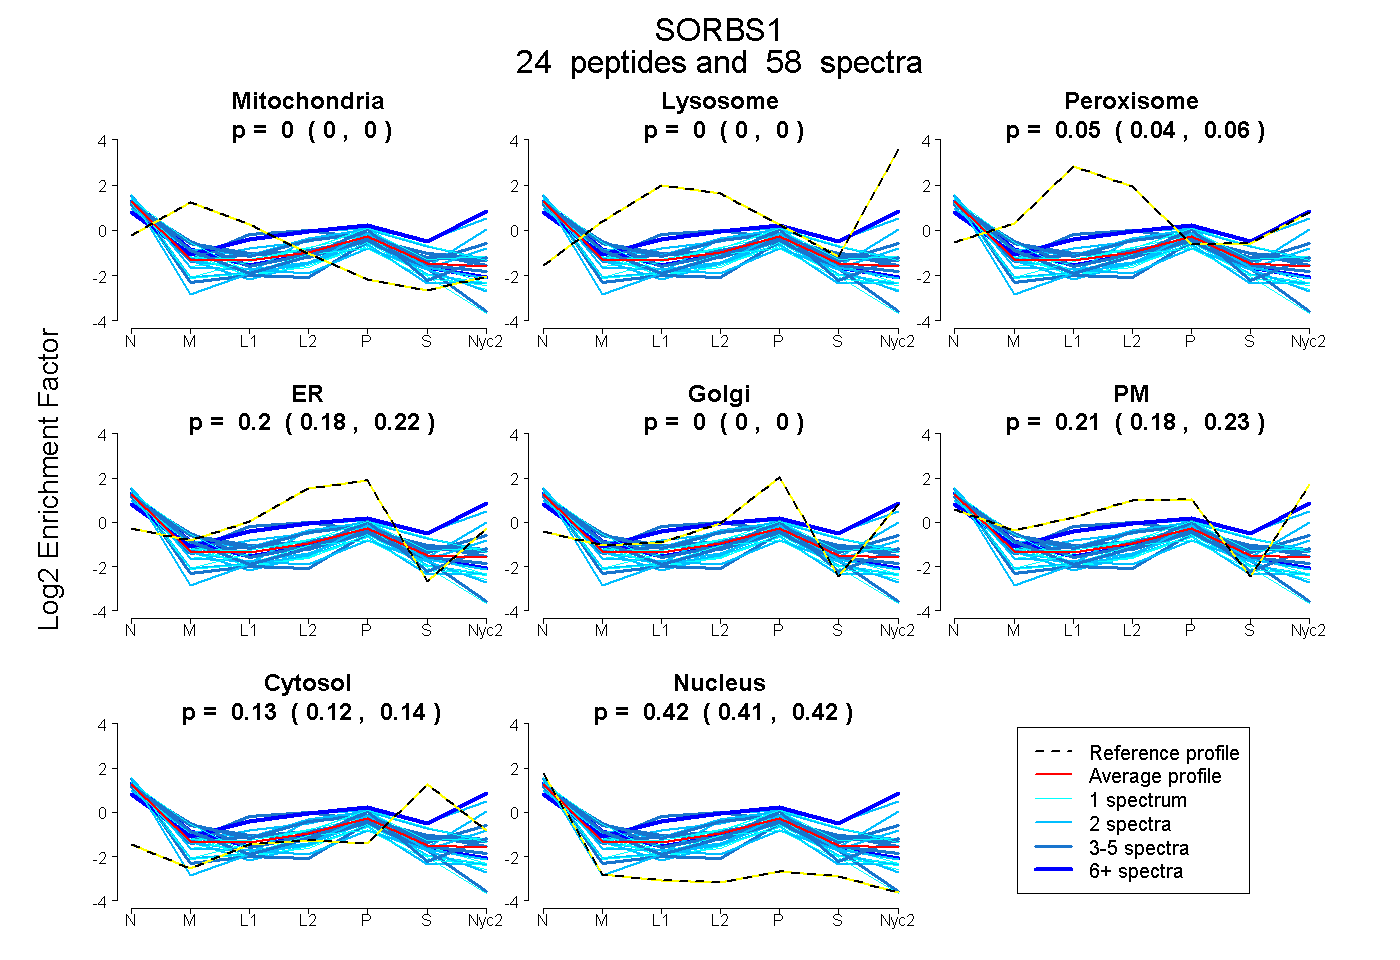
0.000 | 0.000
0.000 | 0.000
0.035 | 0.056
0.181 | 0.215
0.000 | 0.000
0.180 | 0.227
0.122 | 0.136
0.412 | 0.423
6peptides
spectra
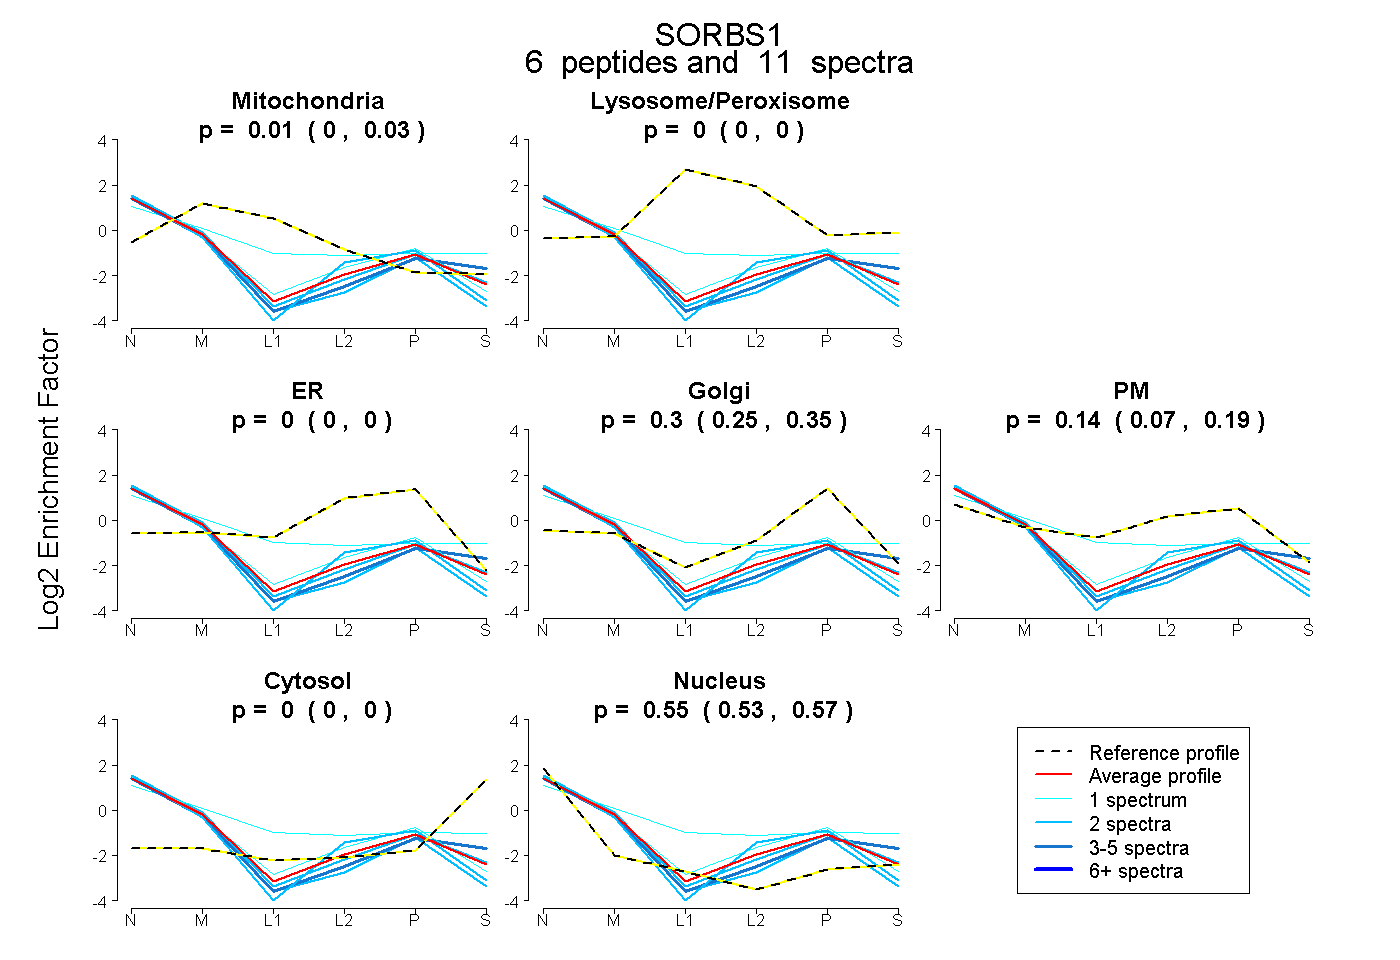
0.000 | 0.029
0.000 | 0.000
0.000 | 0.000
0.251 | 0.354
0.066 | 0.188
0.000 | 0.000
0.533 | 0.570