 24
24peptides
spectra
0.000 | 0.000
0.000 | 0.000
0.035 | 0.056
0.181 | 0.215
0.000 | 0.000
0.180 | 0.227
0.122 | 0.136
0.412 | 0.423
| Plot | Mito | Lyso | Perox | ER | Golgi | PM | Cytosol | Nucleus | |||||
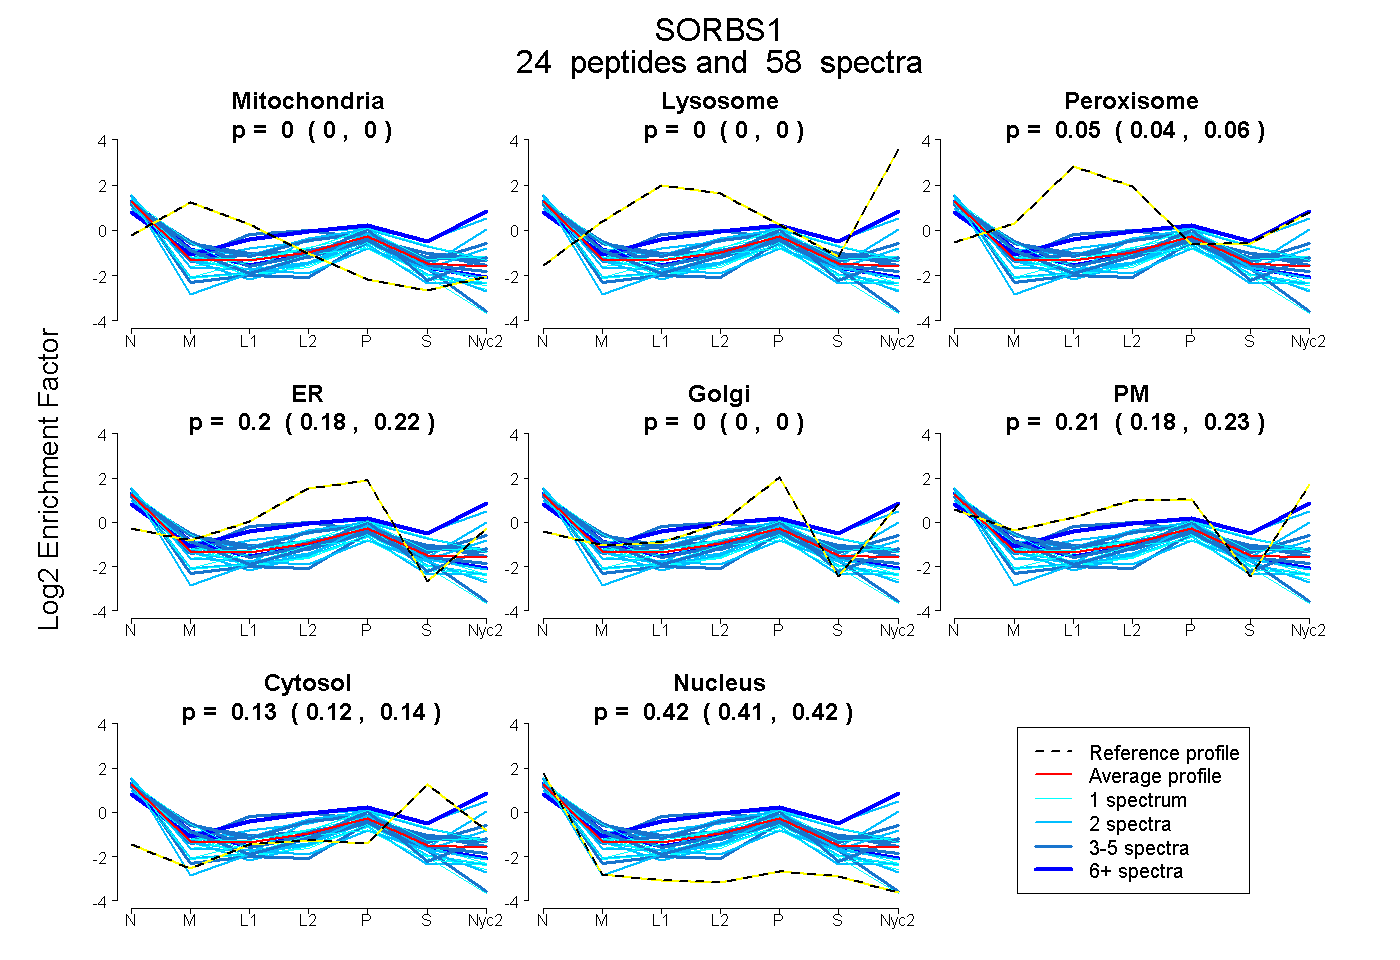
| Expt A |
24 peptides |
58 spectra |
|
0.000 0.000 | 0.000 |
0.000 0.000 | 0.000 |
0.047 0.035 | 0.056 |
0.199 0.181 | 0.215 |
0.000 0.000 | 0.000 |
0.206 0.180 | 0.227 |
0.130 0.122 | 0.136 |
0.418 0.412 | 0.423 |
| 6 spectra, SEMNYIDGEK | 0.000 | 0.000 | 0.000 | 0.000 | 0.000 | 0.625 | 0.356 | 0.018 | ||
| 1 spectrum, RPSSSASTK | 0.015 | 0.000 | 0.092 | 0.397 | 0.000 | 0.000 | 0.000 | 0.496 | ||
| 1 spectrum, SVLEGGDIPLQGLSGLK | 0.000 | 0.000 | 0.000 | 0.303 | 0.000 | 0.000 | 0.007 | 0.690 | ||
| 4 spectra, VGIFPR | 0.052 | 0.000 | 0.000 | 0.000 | 0.332 | 0.205 | 0.000 | 0.411 | ||
| 3 spectra, HFIPADYLESTEEFIR | 0.194 | 0.000 | 0.000 | 0.000 | 0.029 | 0.318 | 0.185 | 0.273 | ||
| 1 spectrum, SSVLTNEK | 0.000 | 0.000 | 0.000 | 0.170 | 0.000 | 0.300 | 0.188 | 0.342 | ||
| 2 spectra, LSSLSDPASER | 0.000 | 0.000 | 0.000 | 0.091 | 0.001 | 0.396 | 0.126 | 0.386 | ||
| 2 spectra, QIDQNWYEGEHHGR | 0.014 | 0.000 | 0.084 | 0.254 | 0.000 | 0.153 | 0.239 | 0.255 | ||
| 1 spectrum, QGIFPITYVDVLK | 0.137 | 0.000 | 0.000 | 0.224 | 0.071 | 0.000 | 0.031 | 0.537 | ||
| 1 spectrum, YSFSEDTK | 0.000 | 0.000 | 0.000 | 0.229 | 0.000 | 0.157 | 0.313 | 0.302 | ||
| 1 spectrum, TYIELLPPAEK | 0.222 | 0.000 | 0.000 | 0.278 | 0.000 | 0.037 | 0.000 | 0.463 | ||
| 6 spectra, DGDIVDVMEK | 0.130 | 0.000 | 0.000 | 0.280 | 0.000 | 0.089 | 0.094 | 0.409 | ||
| 2 spectra, ASSSYR | 0.000 | 0.000 | 0.000 | 0.000 | 0.000 | 0.544 | 0.358 | 0.099 | ||
| 2 spectra, GDIVYIYK | 0.000 | 0.000 | 0.100 | 0.000 | 0.000 | 0.585 | 0.083 | 0.233 | ||
| 1 spectrum, LAPVQVLEYGEAIAK | 0.089 | 0.000 | 0.000 | 0.186 | 0.071 | 0.043 | 0.118 | 0.493 | ||
| 3 spectra, SATVSPQQPQAQQR | 0.000 | 0.000 | 0.000 | 0.236 | 0.000 | 0.000 | 0.085 | 0.679 | ||
| 2 spectra, SPLSVPR | 0.000 | 0.000 | 0.000 | 0.201 | 0.143 | 0.000 | 0.128 | 0.528 | ||
| 2 spectra, EQEEADIAAR | 0.038 | 0.000 | 0.000 | 0.213 | 0.079 | 0.080 | 0.000 | 0.589 | ||
| 3 spectra, QVDENWYEGR | 0.207 | 0.000 | 0.000 | 0.148 | 0.073 | 0.126 | 0.101 | 0.345 | ||
| 3 spectra, ESDGTPGGLASLENER | 0.000 | 0.000 | 0.123 | 0.142 | 0.000 | 0.165 | 0.180 | 0.390 | ||
| 2 spectra, FGDLLNIDDTAK | 0.049 | 0.000 | 0.000 | 0.304 | 0.008 | 0.060 | 0.049 | 0.531 | ||
| 3 spectra, SGLEMRPAR | 0.089 | 0.000 | 0.000 | 0.012 | 0.000 | 0.506 | 0.154 | 0.239 | ||
| 4 spectra, HTGVIPTHHQFITNER | 0.000 | 0.000 | 0.325 | 0.204 | 0.000 | 0.051 | 0.088 | 0.332 | ||
| 2 spectra, TPVDYIDLPYSSSPSR | 0.015 | 0.000 | 0.060 | 0.219 | 0.014 | 0.000 | 0.075 | 0.618 |
| Plot | Mito | Lyso or Perox | ER | Golgi | PM | Cytosol | Nucleus | ||||||
| Expt B |
6 peptides |
11 spectra |
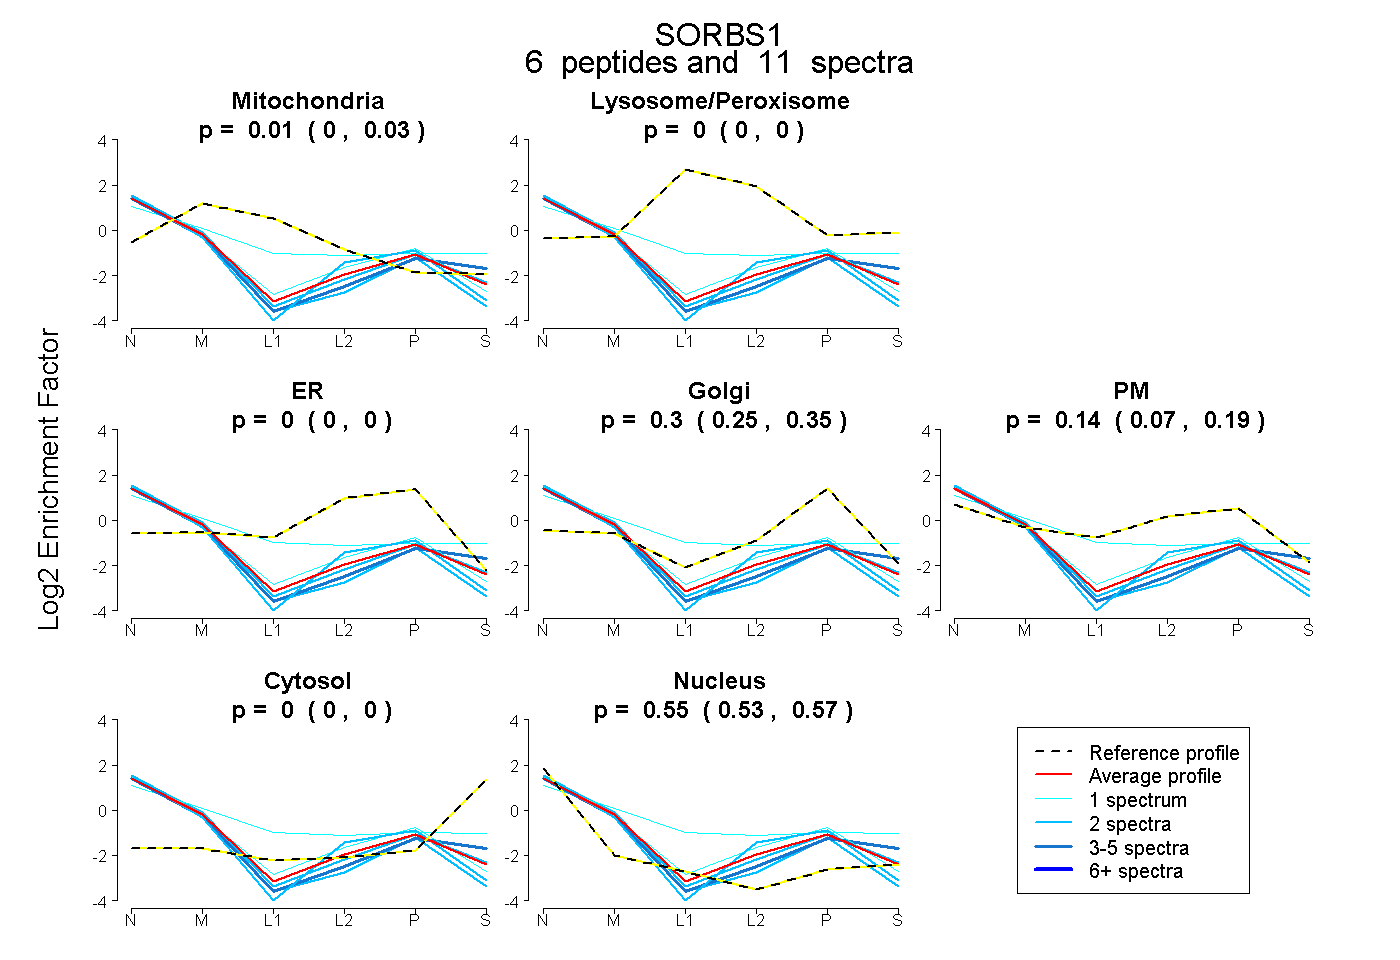 |
0.005 0.000 | 0.029 |
0.000 0.000 | 0.000 |
0.000 0.000 | 0.000 |
0.305 0.251 | 0.354 |
0.136 0.066 | 0.188 |
0.000 0.000 | 0.000 |
0.554 0.533 | 0.570 |
|||
| Plot | Lyso | Other | |||||||||||
| Expt C |
9 peptides |
17 spectra |
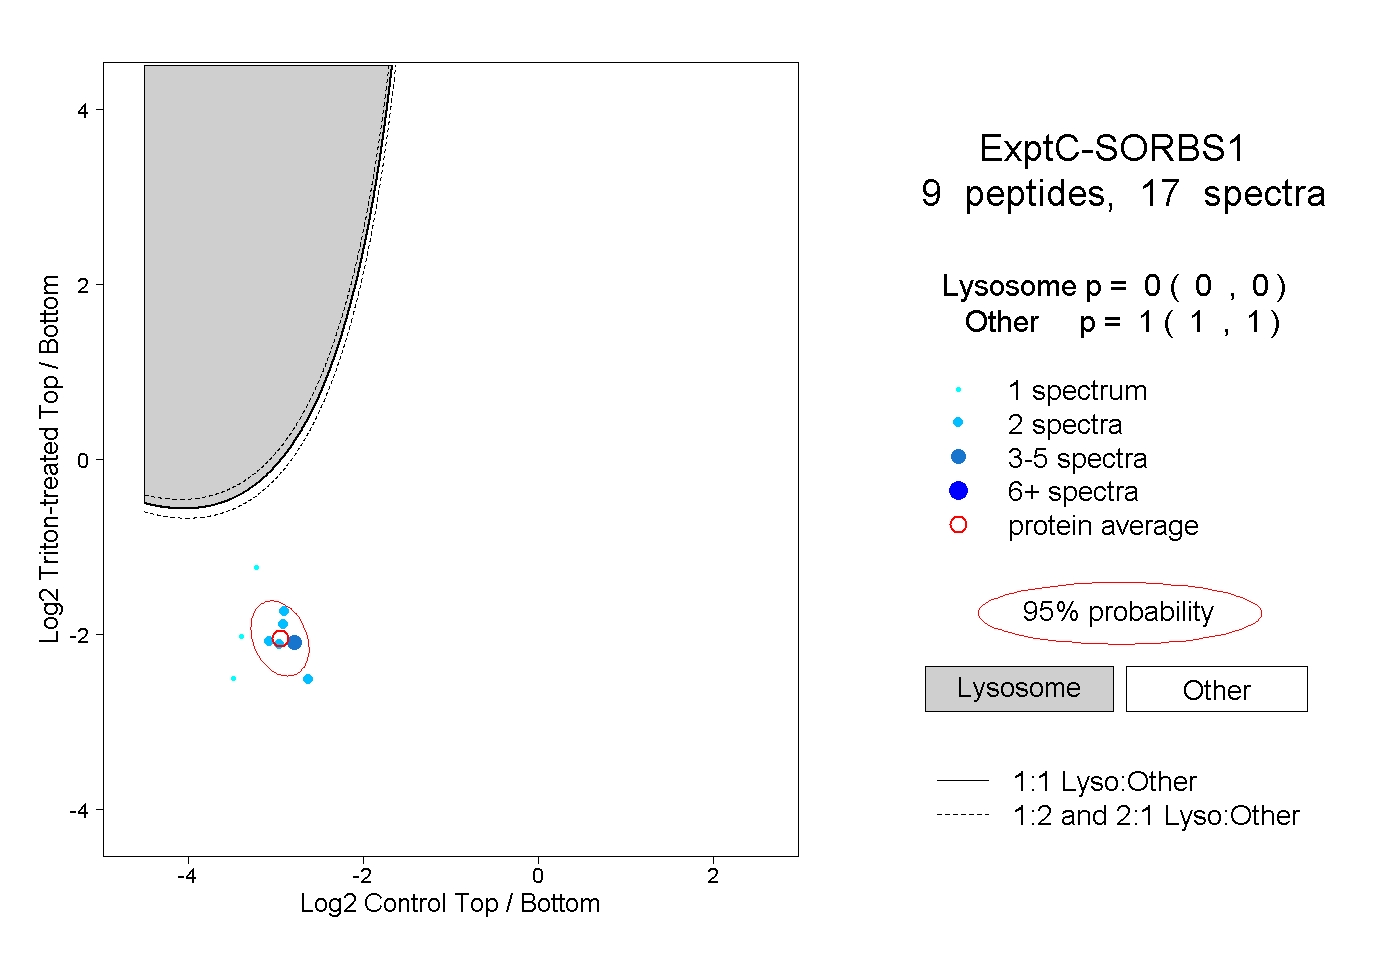 |
0.000 0.000 | 0.000 |
1.000 1.000 | 1.000 |
||||||||
| Plot | Lyso | Other | |||||||||||
| Expt D |
5 peptides |
10 spectra |
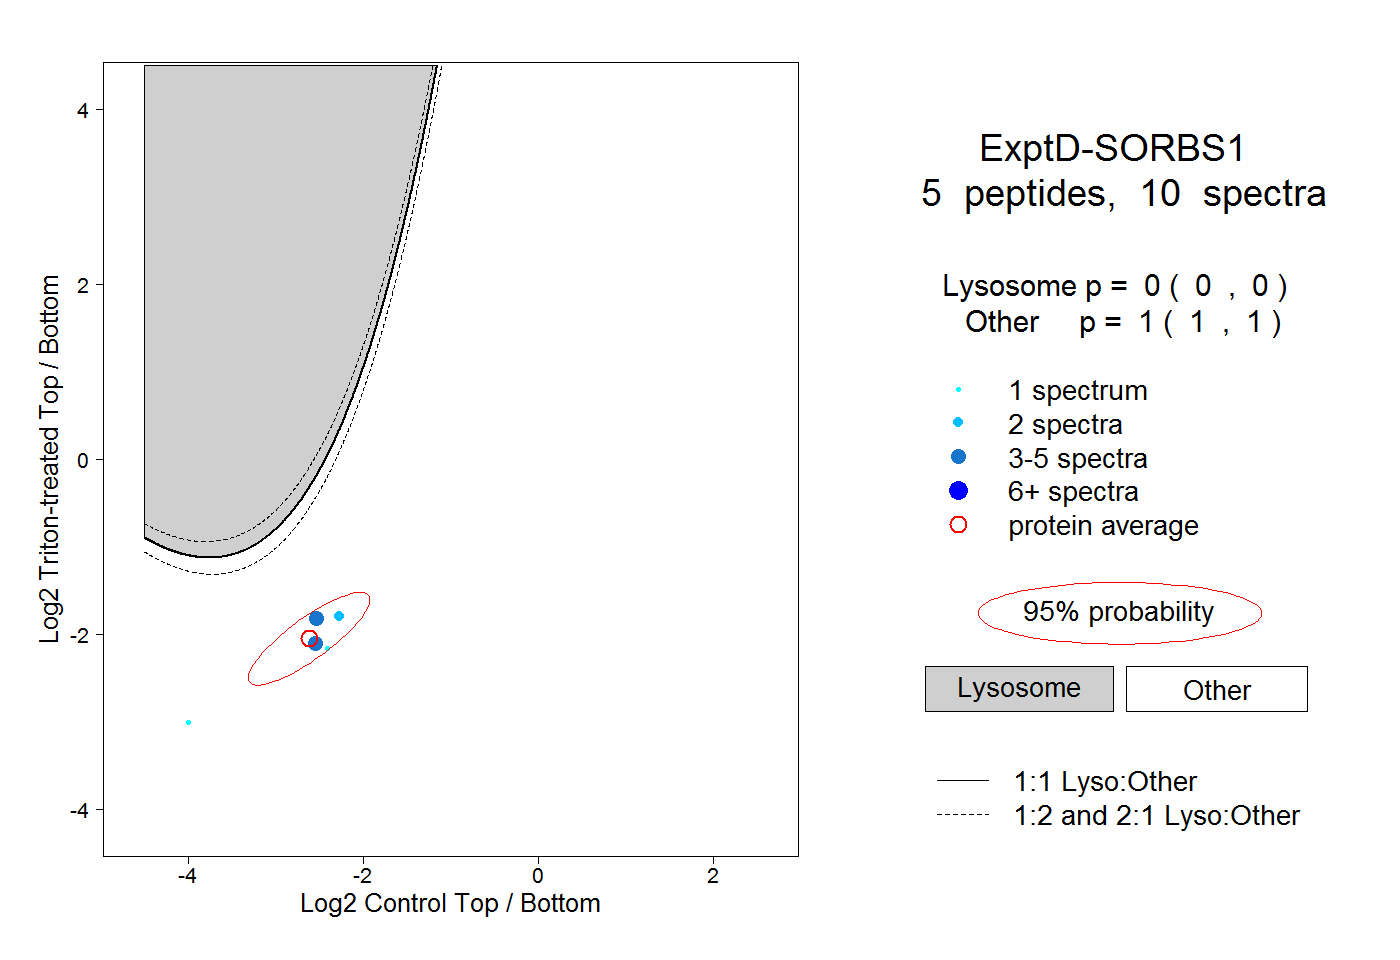 |
0.000 0.000 | 0.000 |
1.000 1.000 | 1.000 |