 16
16peptides
spectra
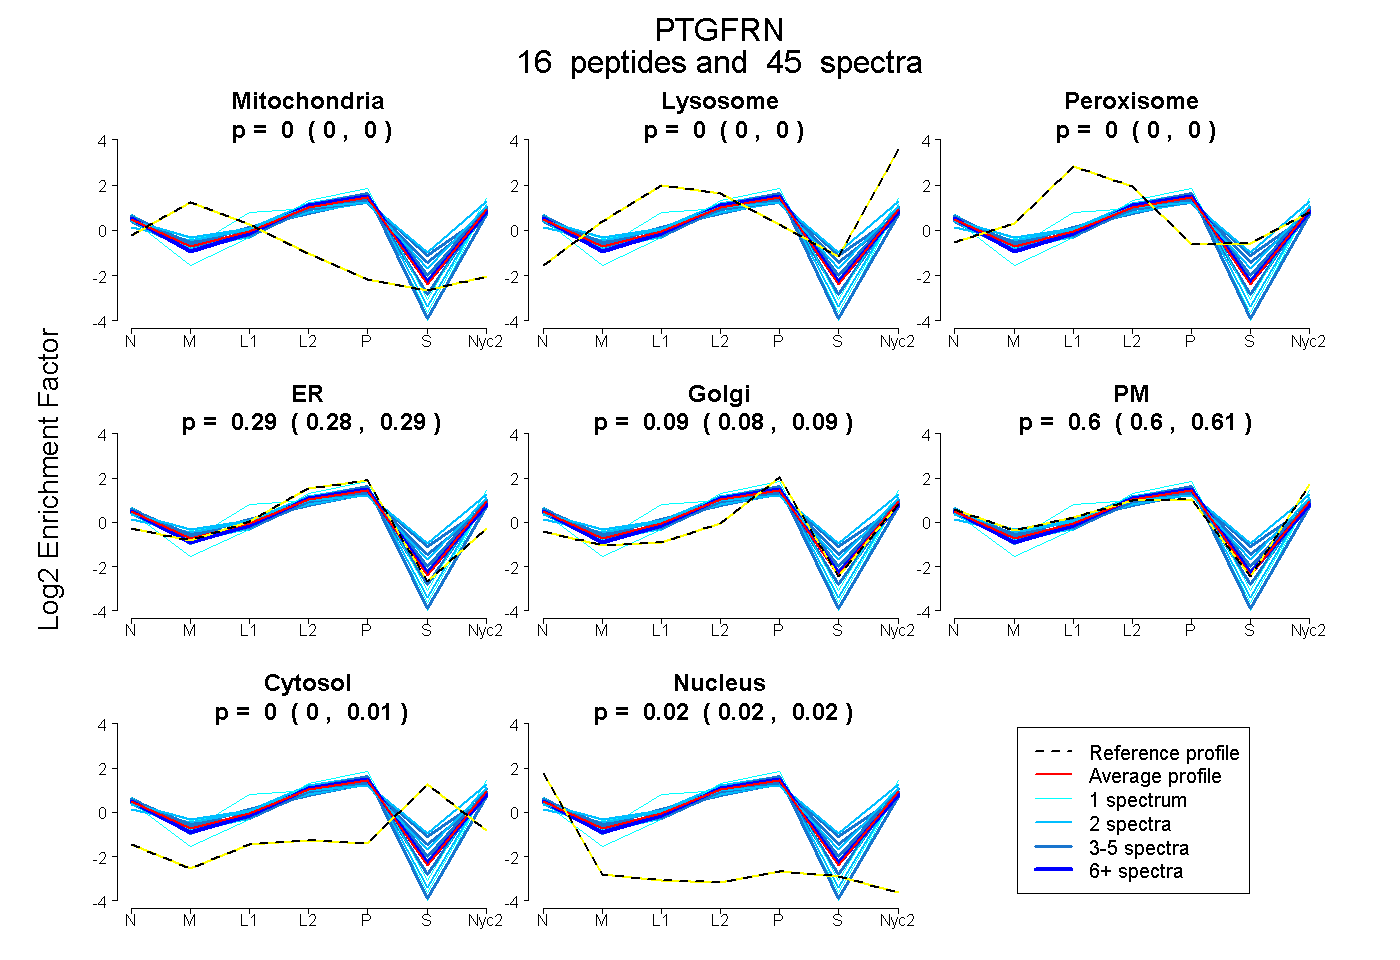
0.000 | 0.000
0.000 | 0.000
0.000 | 0.000
0.280 | 0.293
0.080 | 0.095
0.596 | 0.608
0.000 | 0.009
0.015 | 0.022
7peptides
spectra
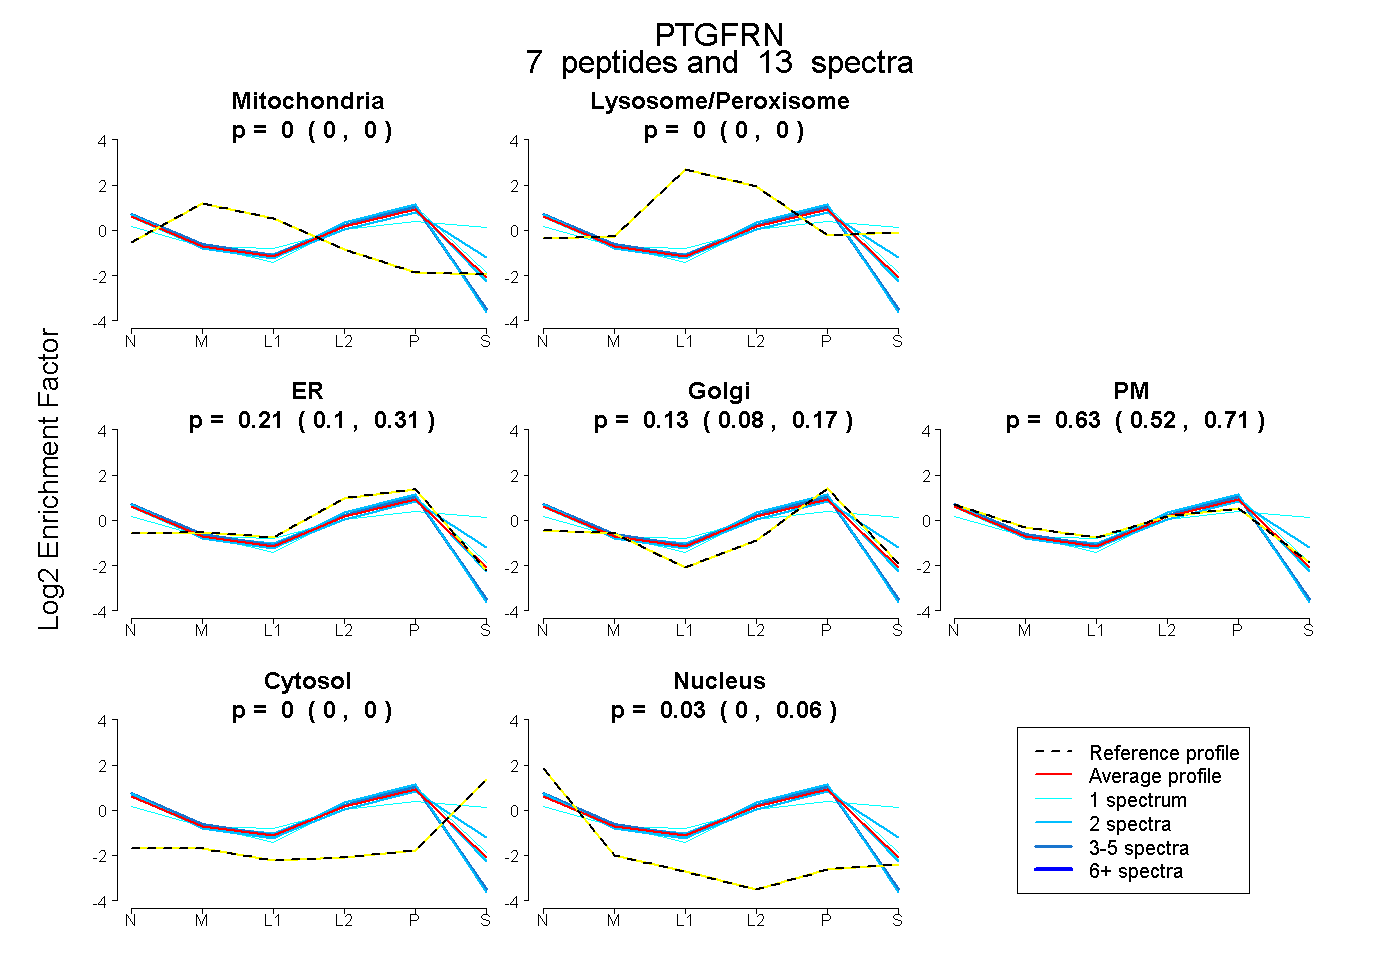
0.000 | 0.000
0.000 | 0.000
0.098 | 0.310
0.076 | 0.169
0.522 | 0.712
0.000 | 0.000
0.000 | 0.063
22peptides
spectra
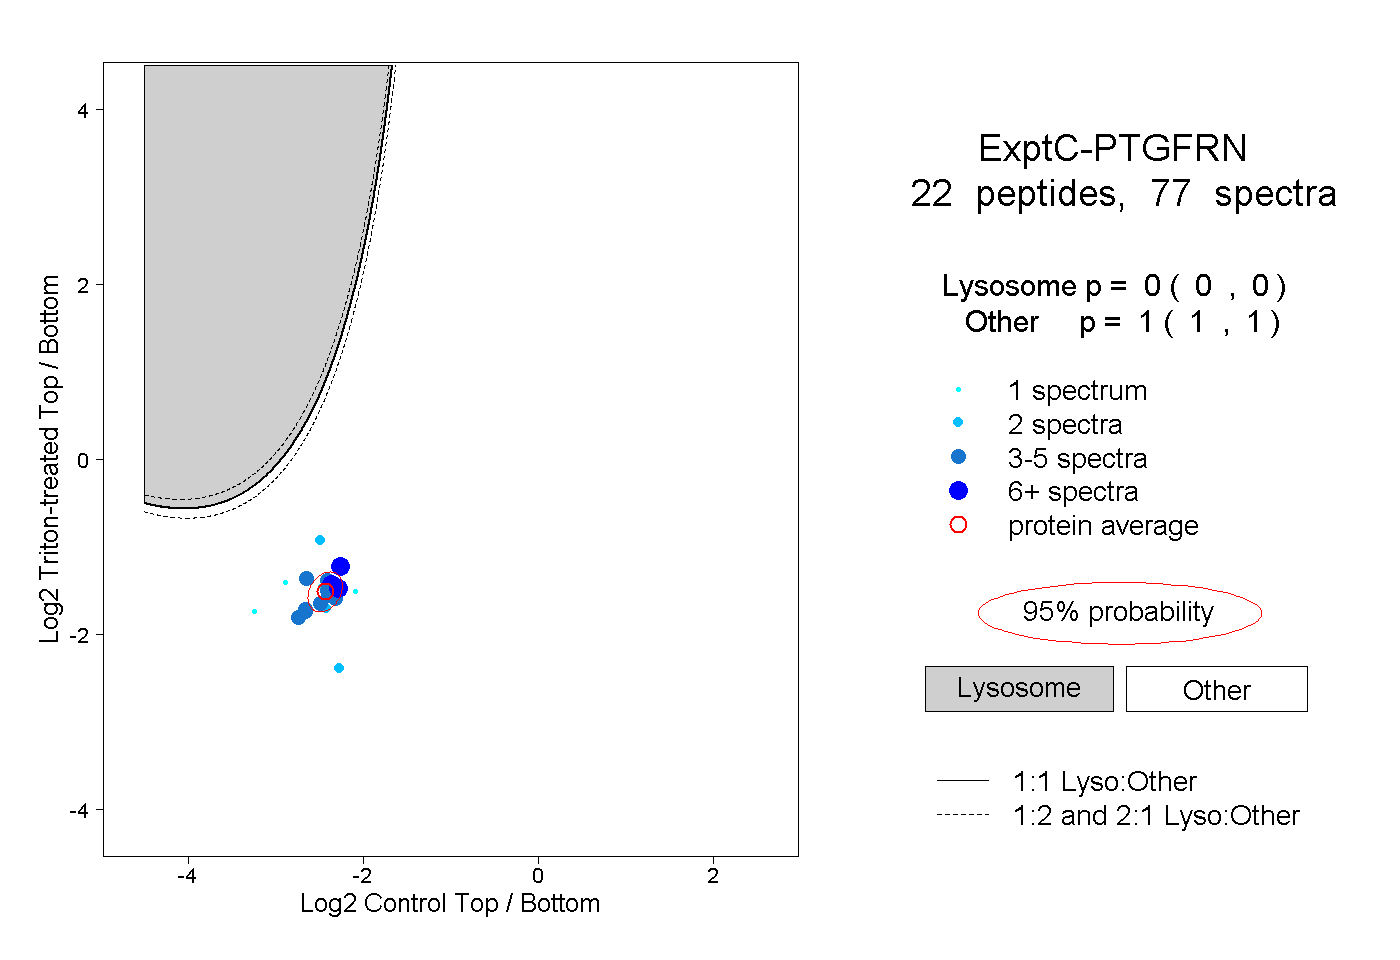
0.000 | 0.000
1.000 | 1.000
4peptides
spectra
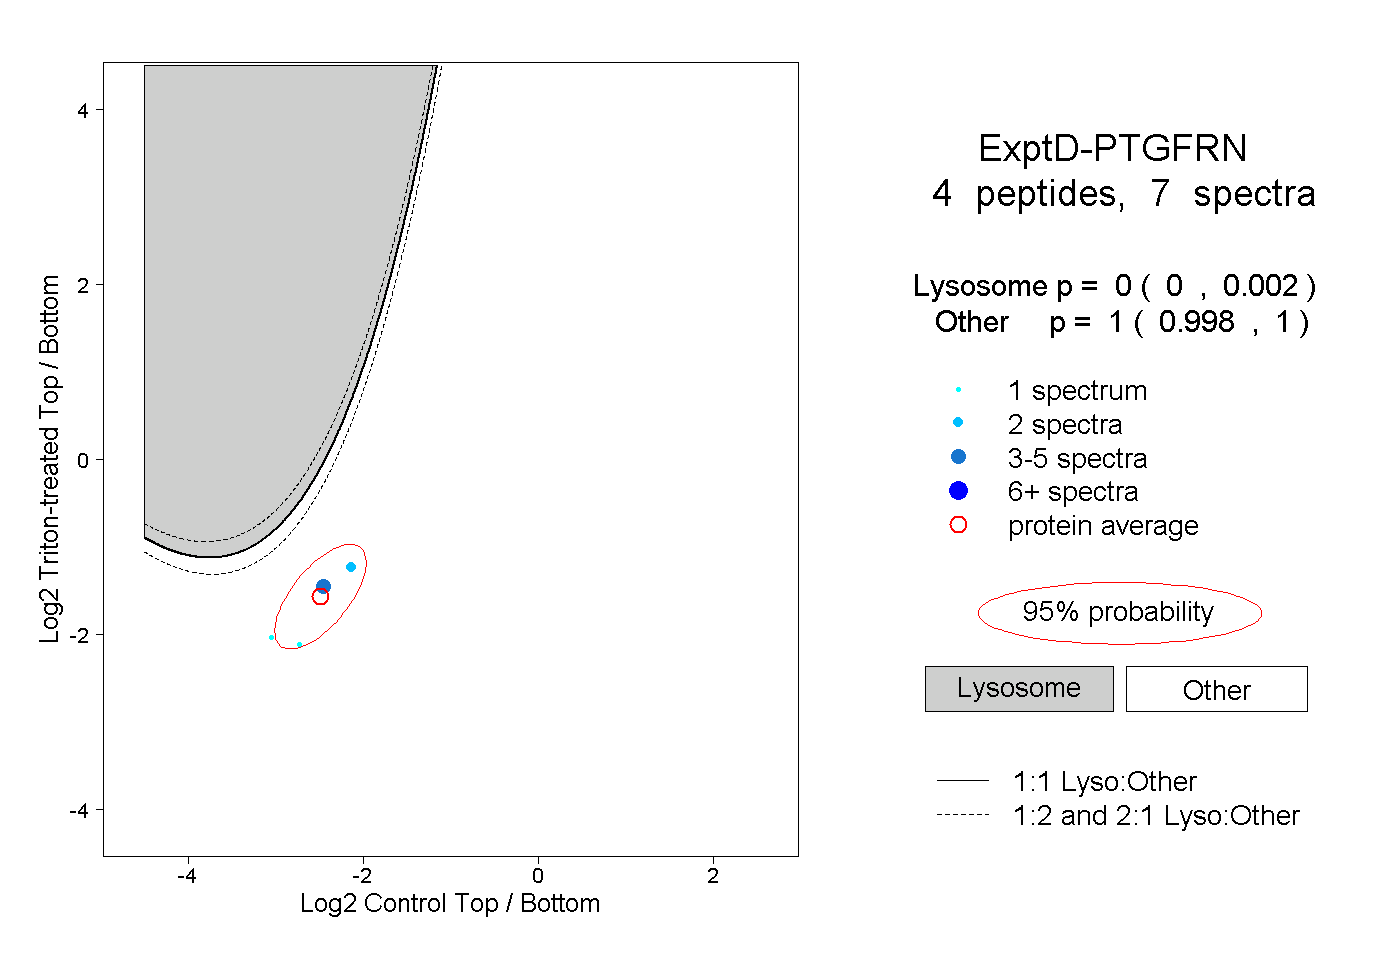
0.000 | 0.002
0.998 | 1.000