22
22peptides
spectra
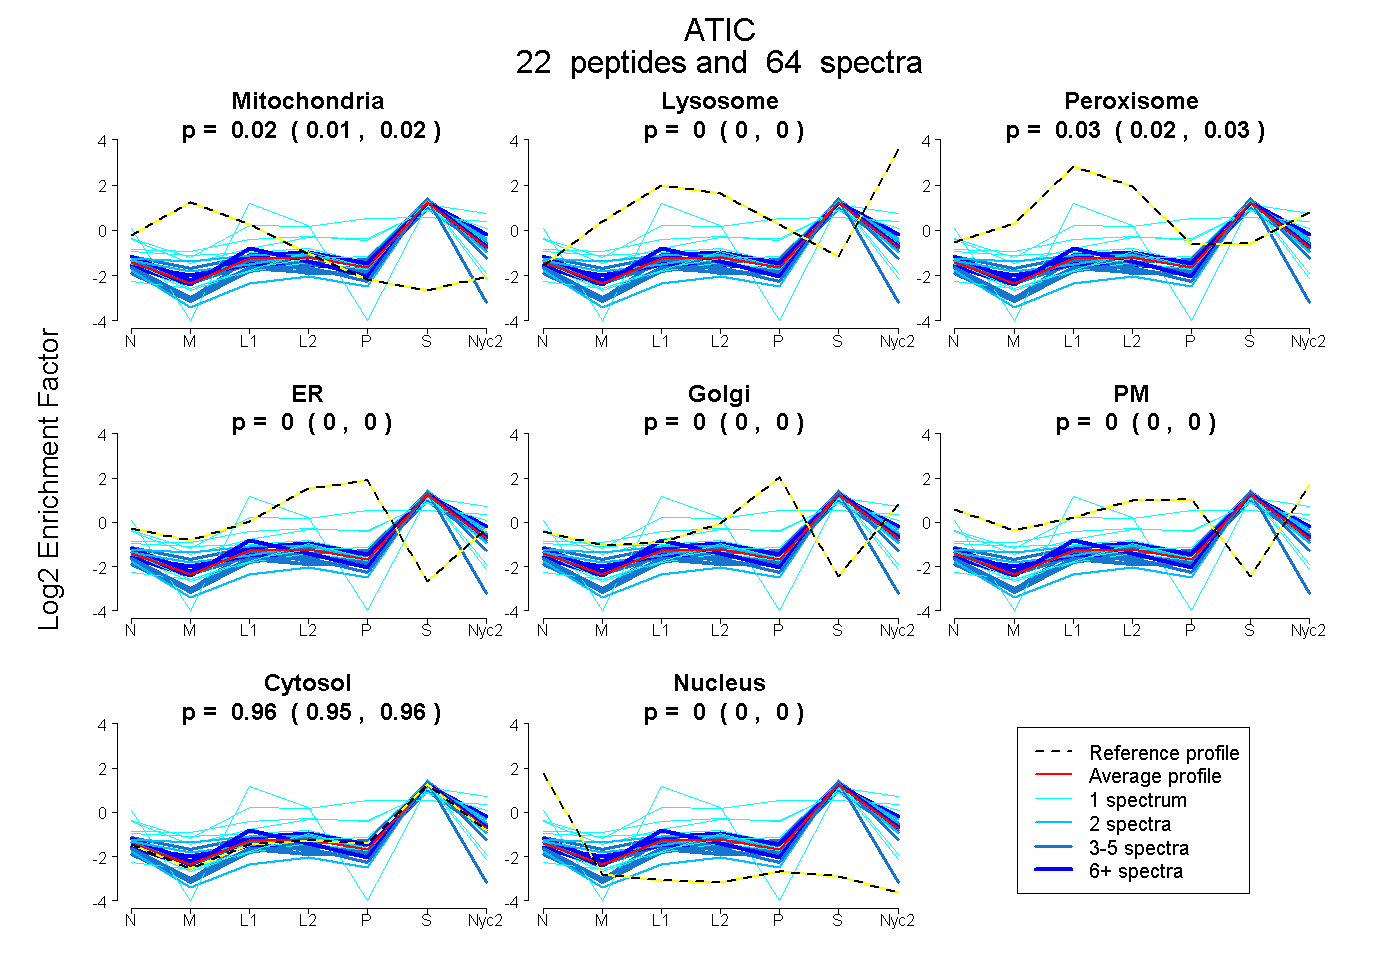
0.010 | 0.021
0.000 | 0.000
0.019 | 0.031
0.000 | 0.000
0.000 | 0.000
0.000 | 0.000
0.954 | 0.962
0.000 | 0.000
17peptides
spectra
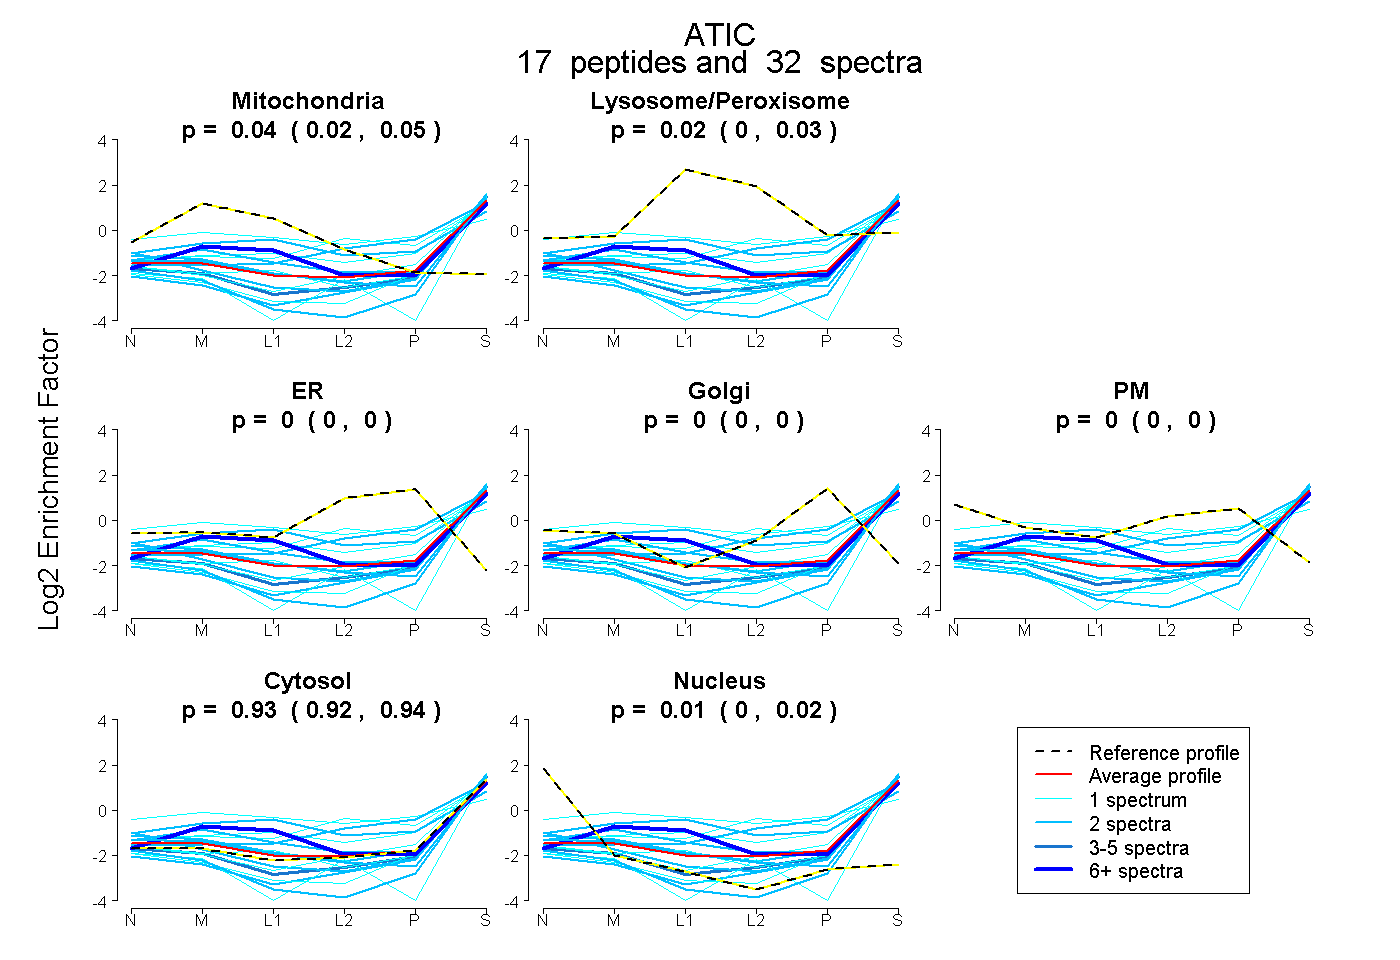
0.018 | 0.054
0.001 | 0.031
0.000 | 0.000
0.000 | 0.000
0.000 | 0.000
0.923 | 0.941
0.002 | 0.021
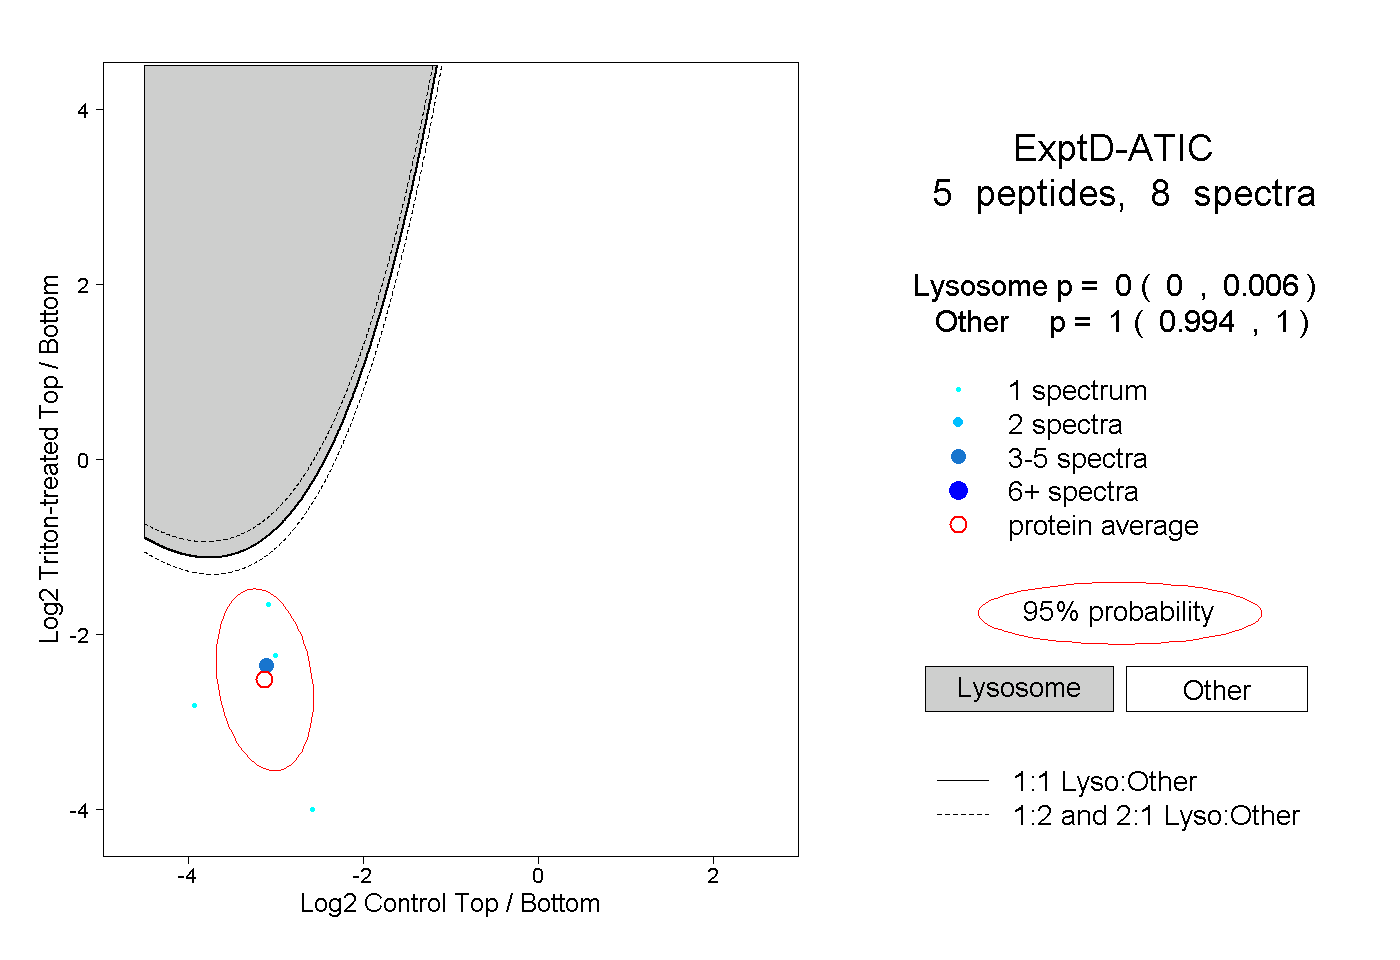
21peptides
spectra
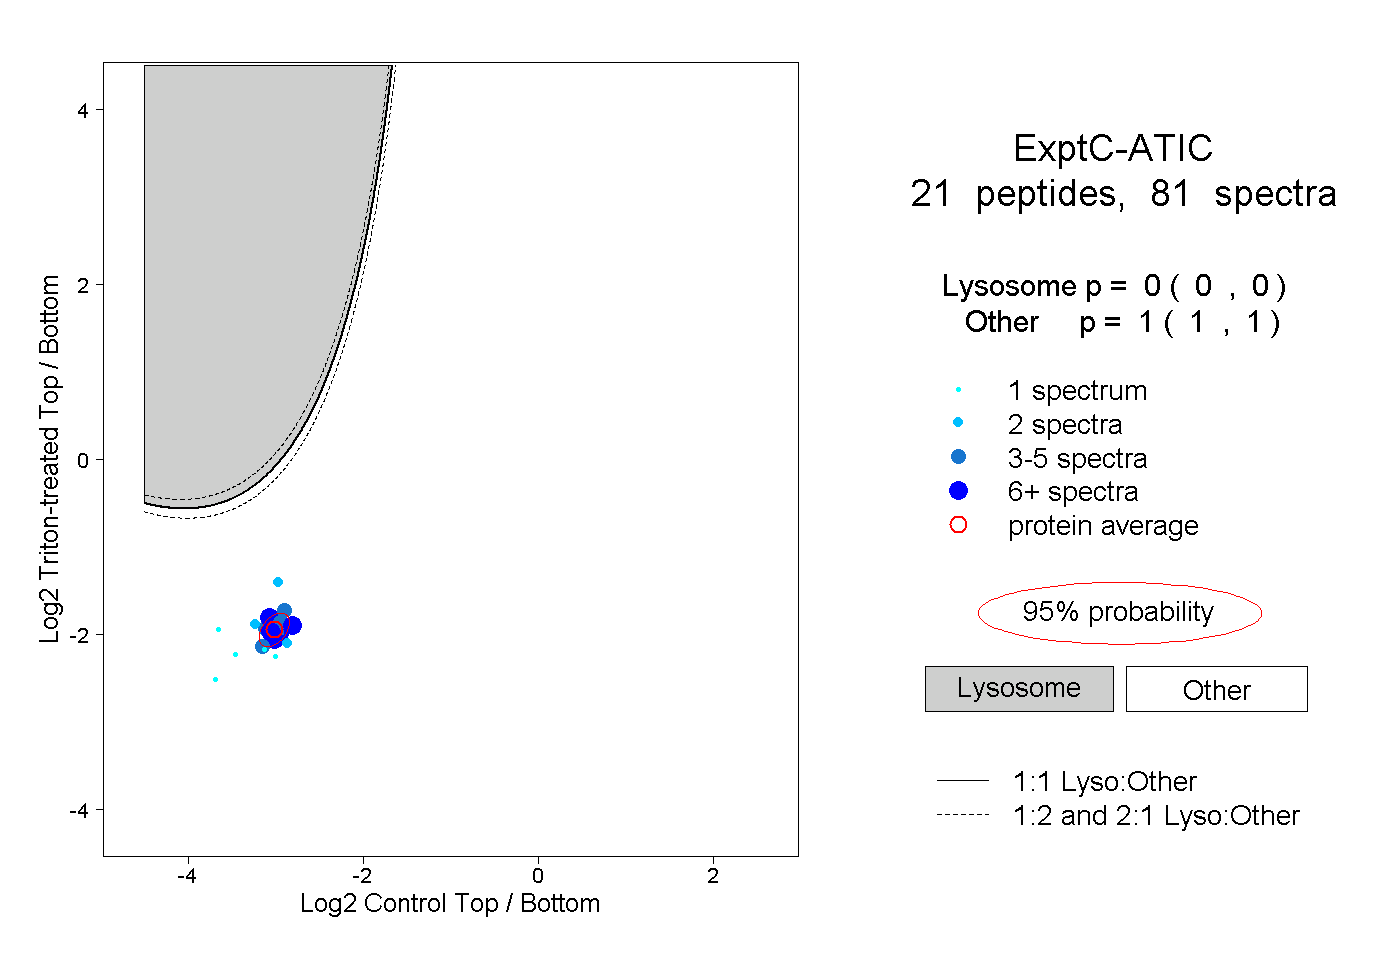
0.000 | 0.000
1.000 | 1.000