9
9peptides
spectra

0.718 | 0.750
0.067 | 0.137
0.085 | 0.136
0.000 | 0.000
0.000 | 0.000
0.000 | 0.027
0.000 | 0.042
0.000 | 0.036
2peptides
spectra
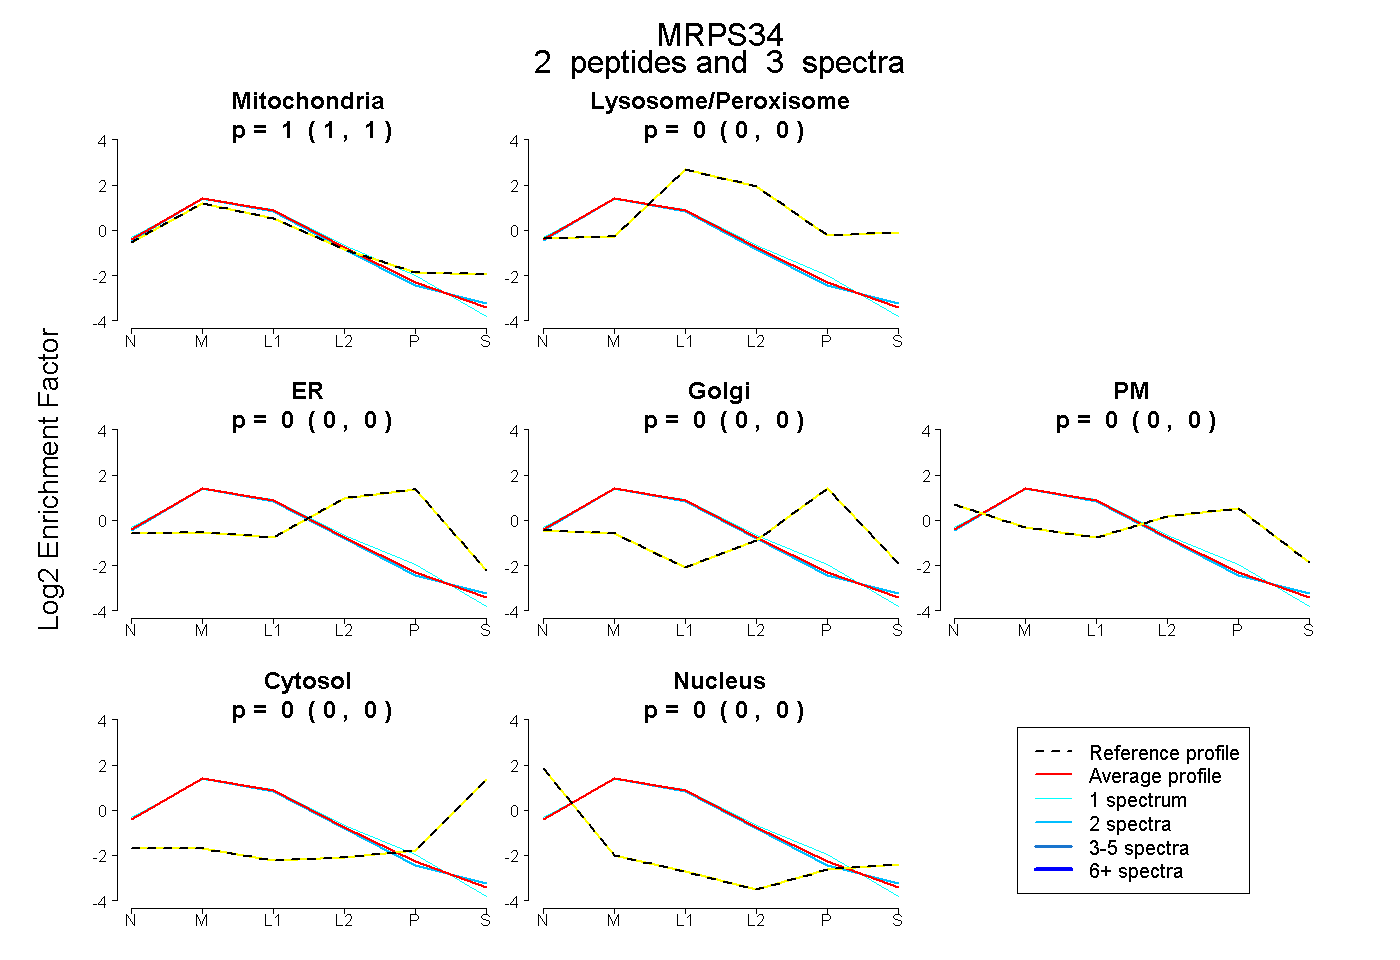
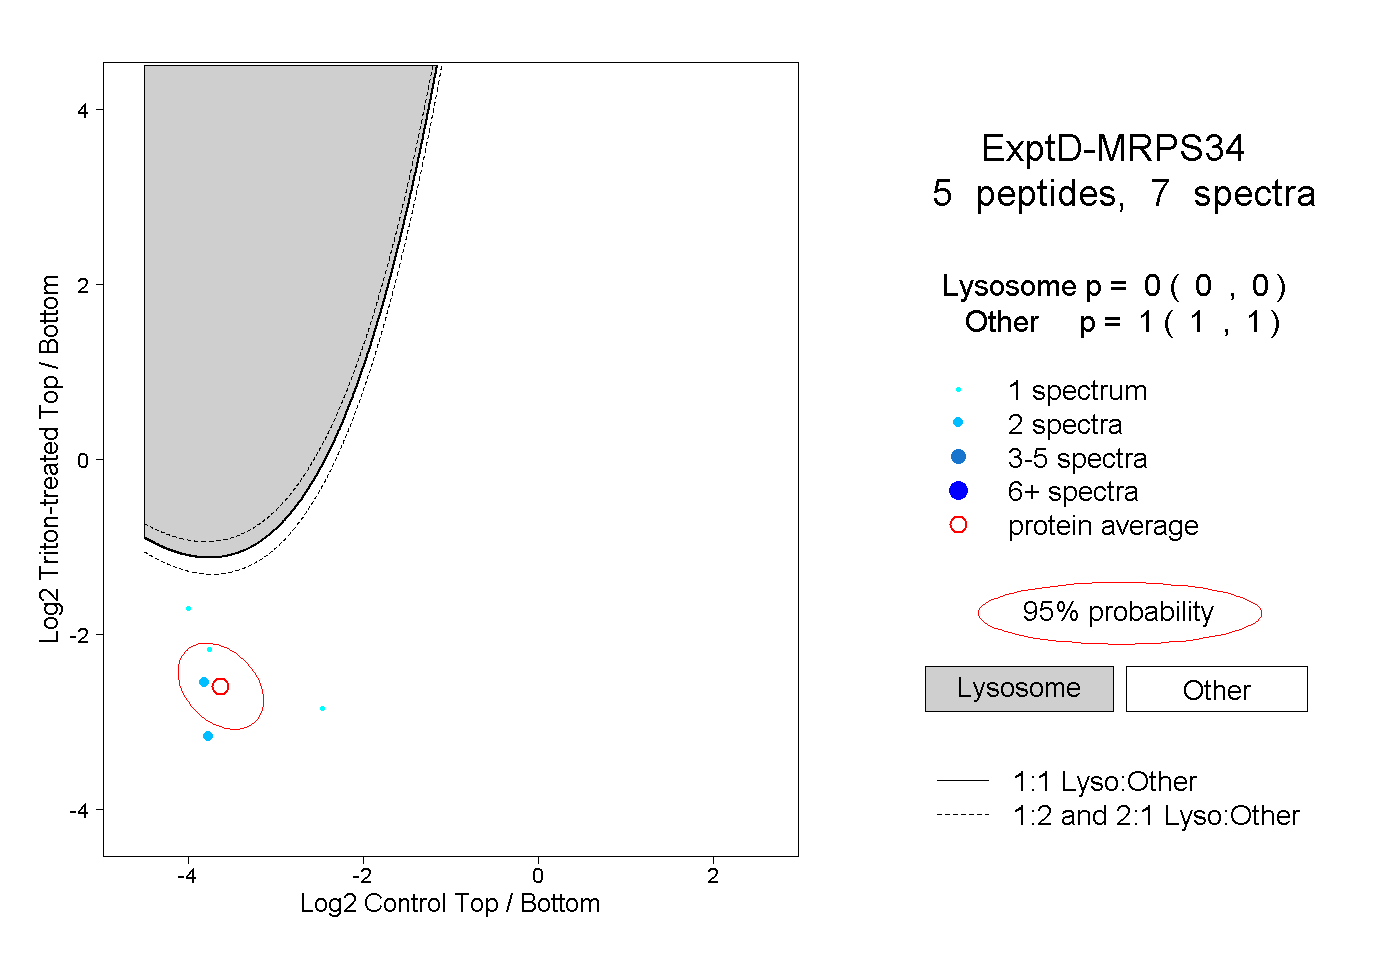
1.000 | 1.000
0.000 | 0.000
0.000 | 0.000
0.000 | 0.000
0.000 | 0.000
0.000 | 0.000
0.000 | 0.000
9peptides
spectra

0.000 | 0.000
1.000 | 1.000