ATXN10
[ENSRNOP00000021071]
Main page
| | | Plot |
Mito |
Lyso |
|
Perox |
ER |
Golgi |
PM |
Cytosol |
Nucleus |
|
| Expt A |
 10
10
peptides |
19
spectra |
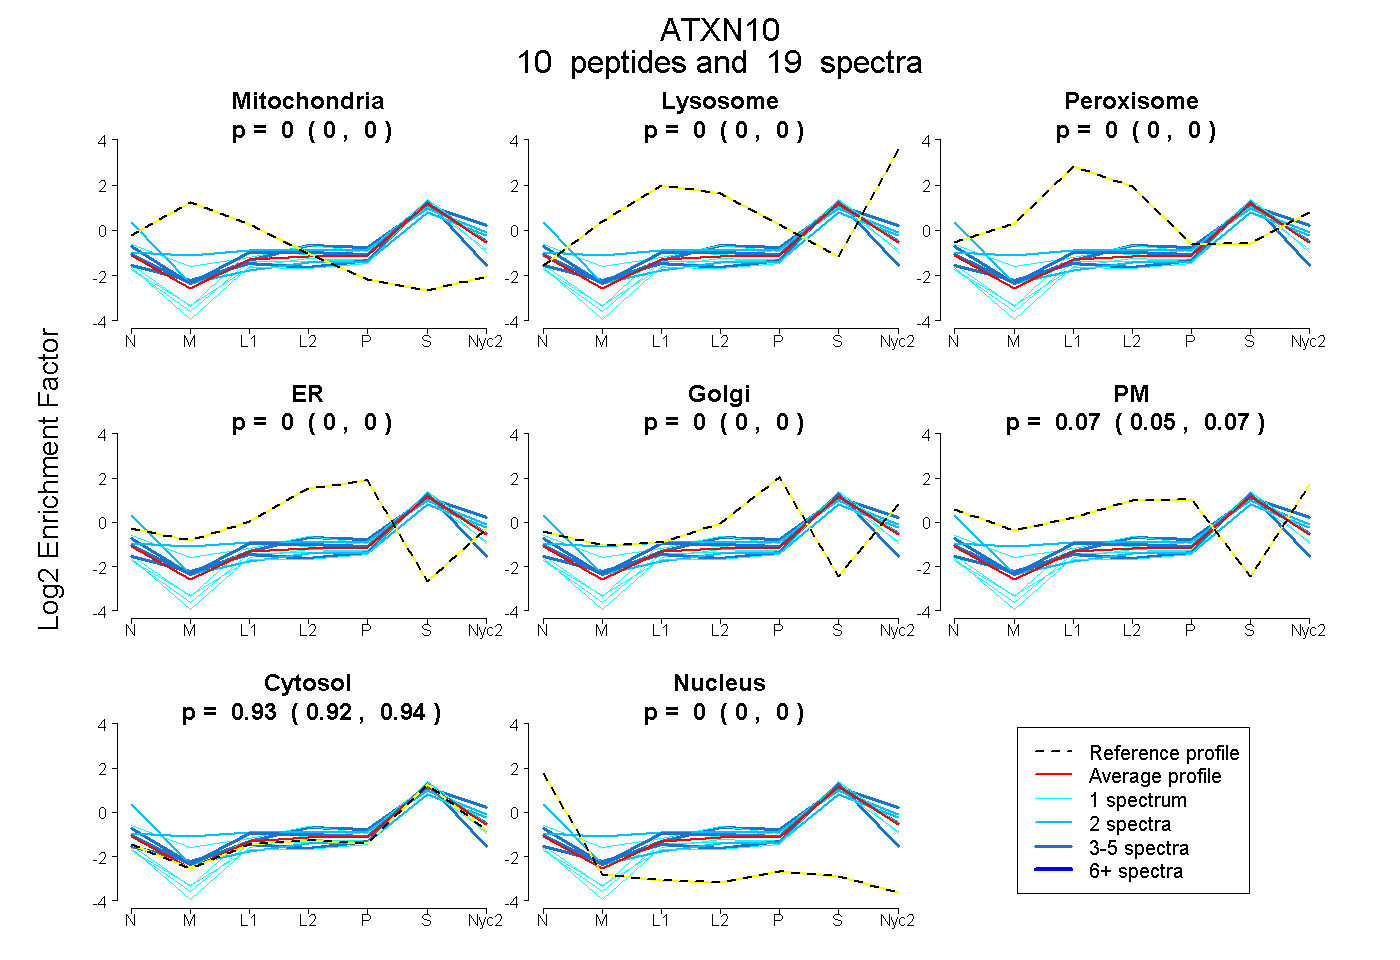 |
0.000
0.000 | 0.000 |
0.000
0.000 | 0.002 |
|
0.000
0.000 | 0.000 |
0.000
0.000 | 0.000 |
0.000
0.000 | 0.002 |
0.065
0.050 | 0.073 |
0.935
0.925 | 0.943 |
0.000
0.000 | 0.000 |
|
| | | Plot |
Mito |
|
Lyso or Perox |
|
ER |
Golgi |
PM |
Cytosol |
Nucleus |
|
| Expt B |
4
peptides |
5
spectra |
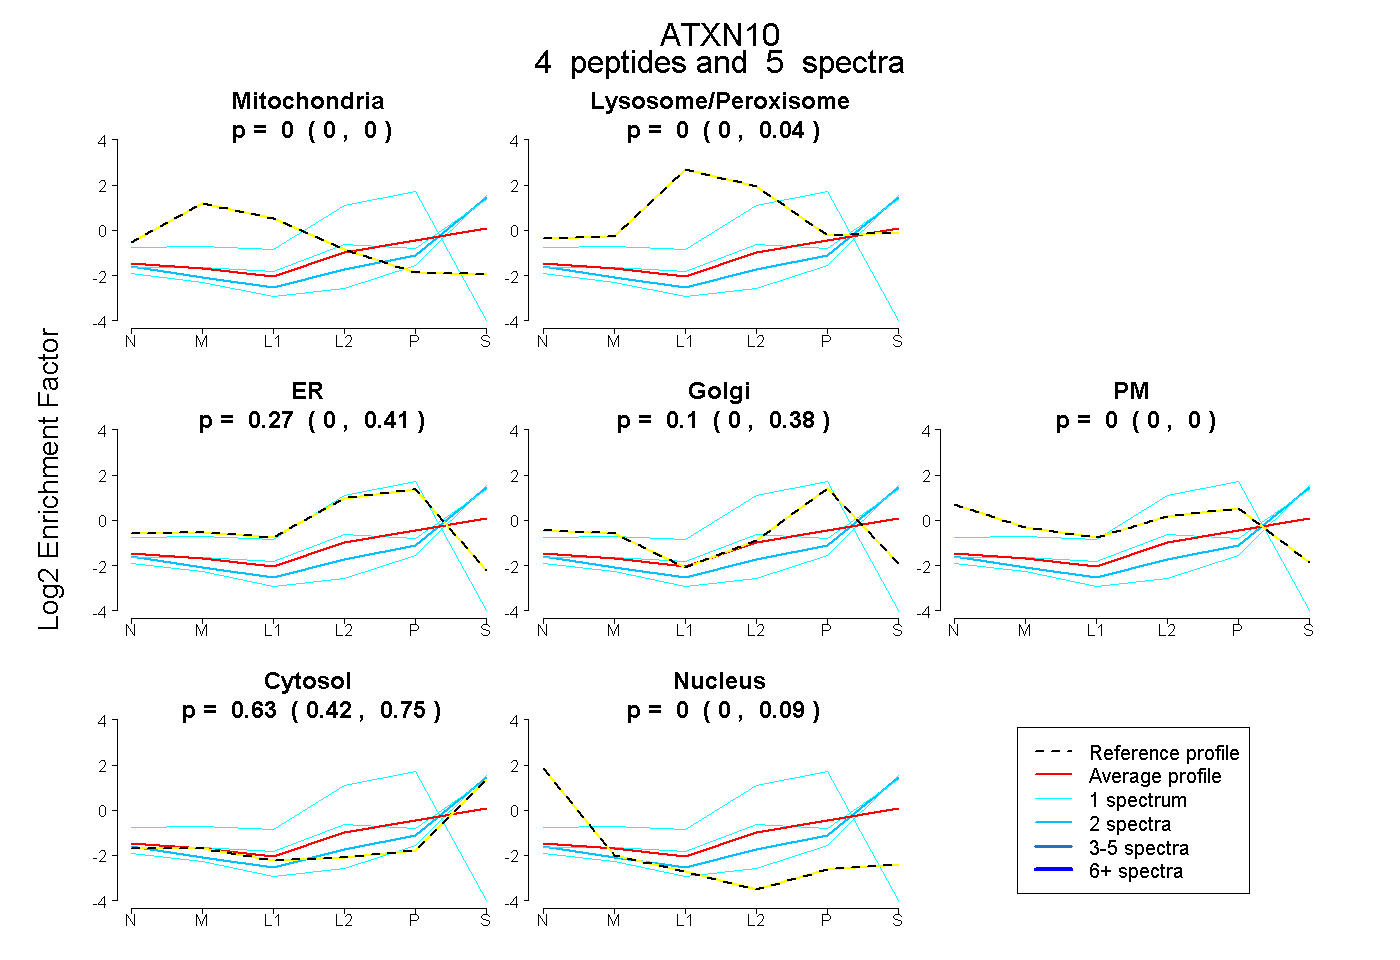 |
0.000
0.000 | 0.000 |
|
0.000
0.000 | 0.037 |
|
0.268
0.000 | 0.410 |
0.103
0.000 | 0.379 |
0.000
0.000 | 0.000 |
0.630
0.417 | 0.751 |
0.000
0.000 | 0.085 |
|
| 1 spectrum, VTLLDIMIAK |
0.000 |
|
0.111 |
|
0.126 |
0.000 |
0.000 |
0.762 |
0.000 |
|
| 2 spectra, VIDVLR |
0.000 |
|
0.000 |
|
0.000 |
0.079 |
0.000 |
0.921 |
0.000 |
|
| 1 spectrum, EALVTIR |
0.000 |
|
0.000 |
|
1.000 |
0.000 |
0.000 |
0.000 |
0.000 |
|
| 1 spectrum, ALTALFK |
0.000 |
|
0.000 |
|
0.000 |
0.000 |
0.000 |
1.000 |
0.000 |
|
| | | Plot |
|
Lyso |
|
|
|
|
|
|
|
Other |
| Expt C |
4
peptides |
7
spectra |
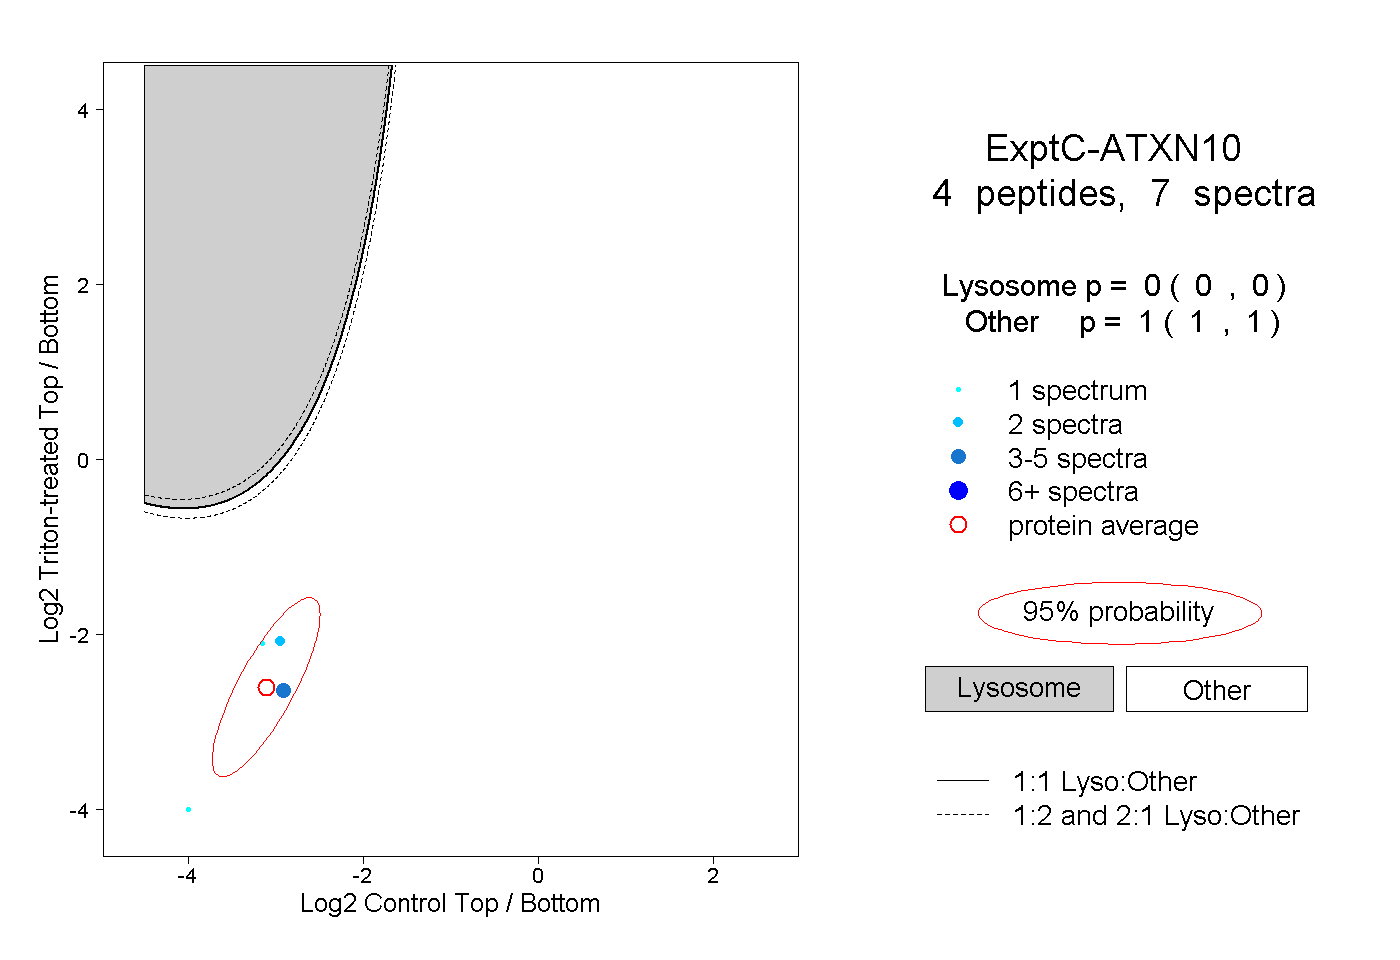 |
|
0.000
0.000 | 0.000 |
|
|
|
|
|
|
|
1.000
1.000 | 1.000 |