 5
5peptides
spectra
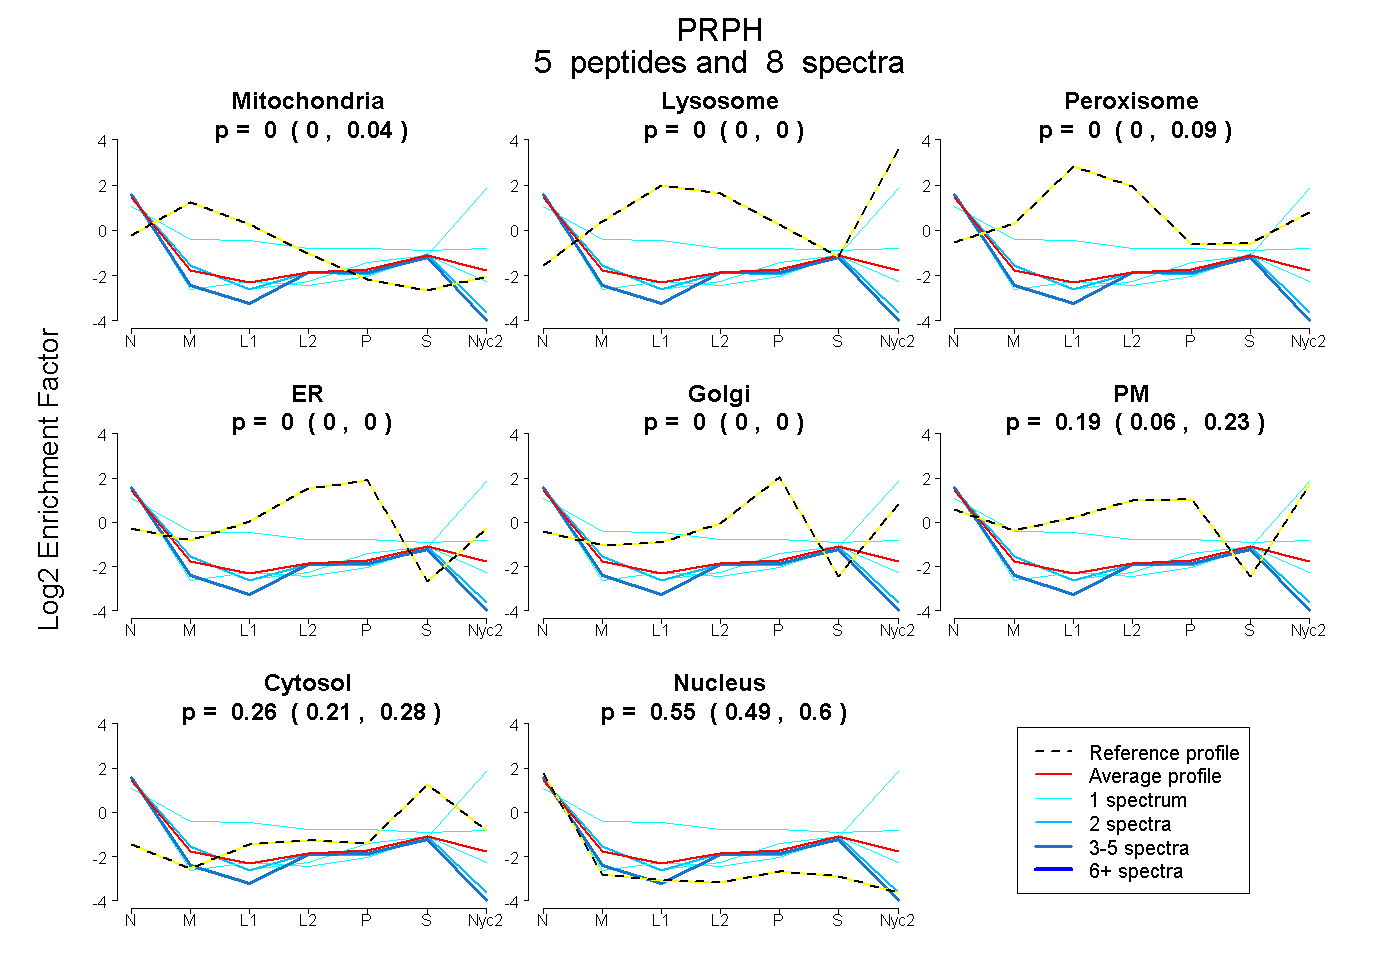
0.000 | 0.043
0.000 | 0.000
0.000 | 0.086
0.000 | 0.000
0.000 | 0.000
0.059 | 0.233
0.215 | 0.277
0.490 | 0.600
1peptide
spectrum
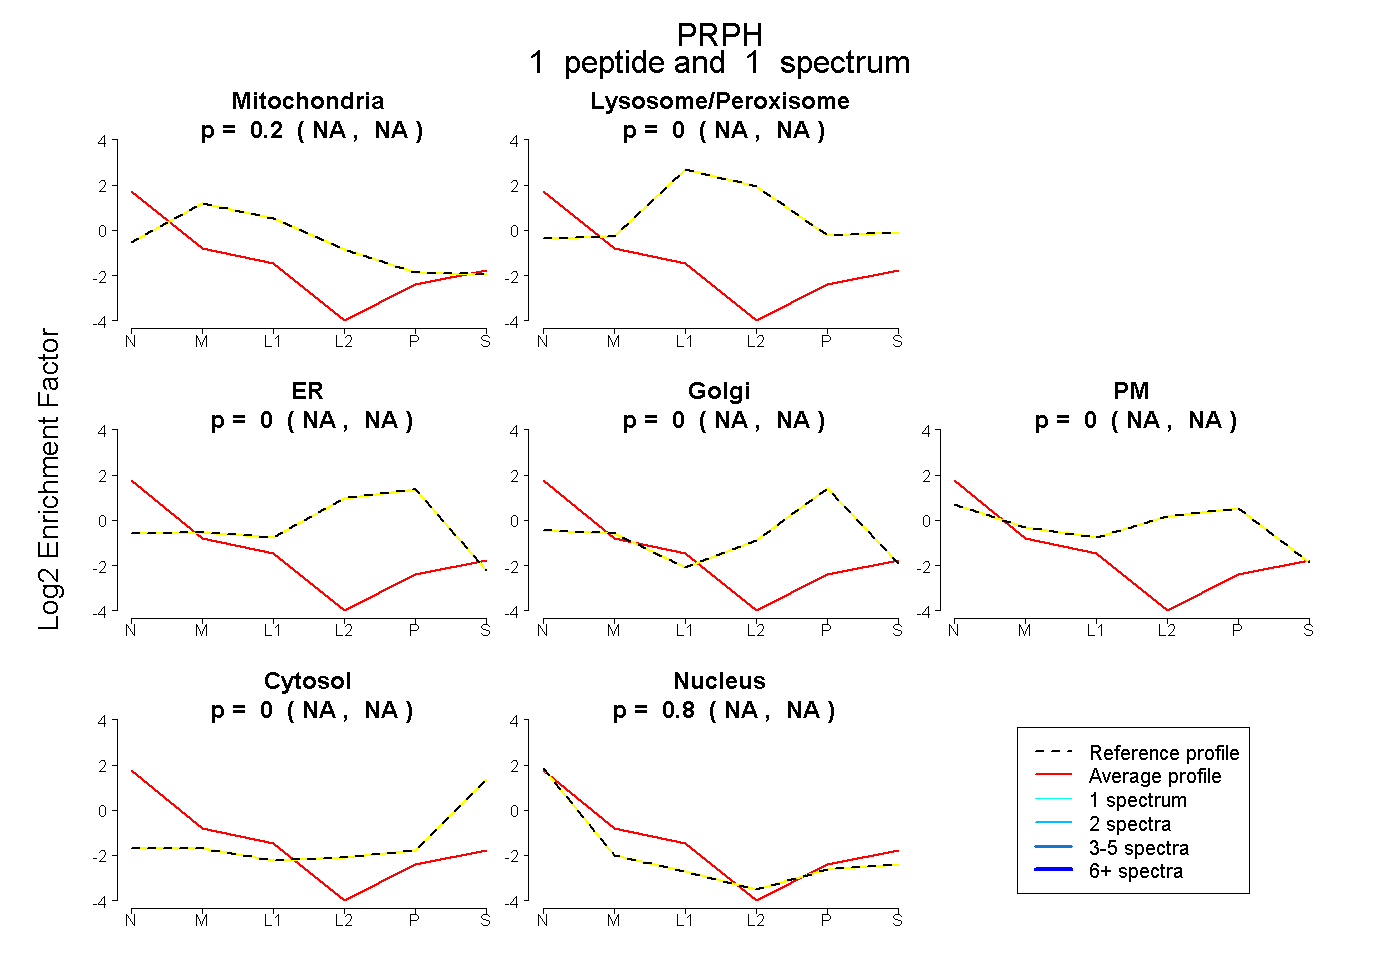
NA | NA
NA | NA
NA | NA
NA | NA
NA | NA
NA | NA
NA | NA
1peptide
spectrum
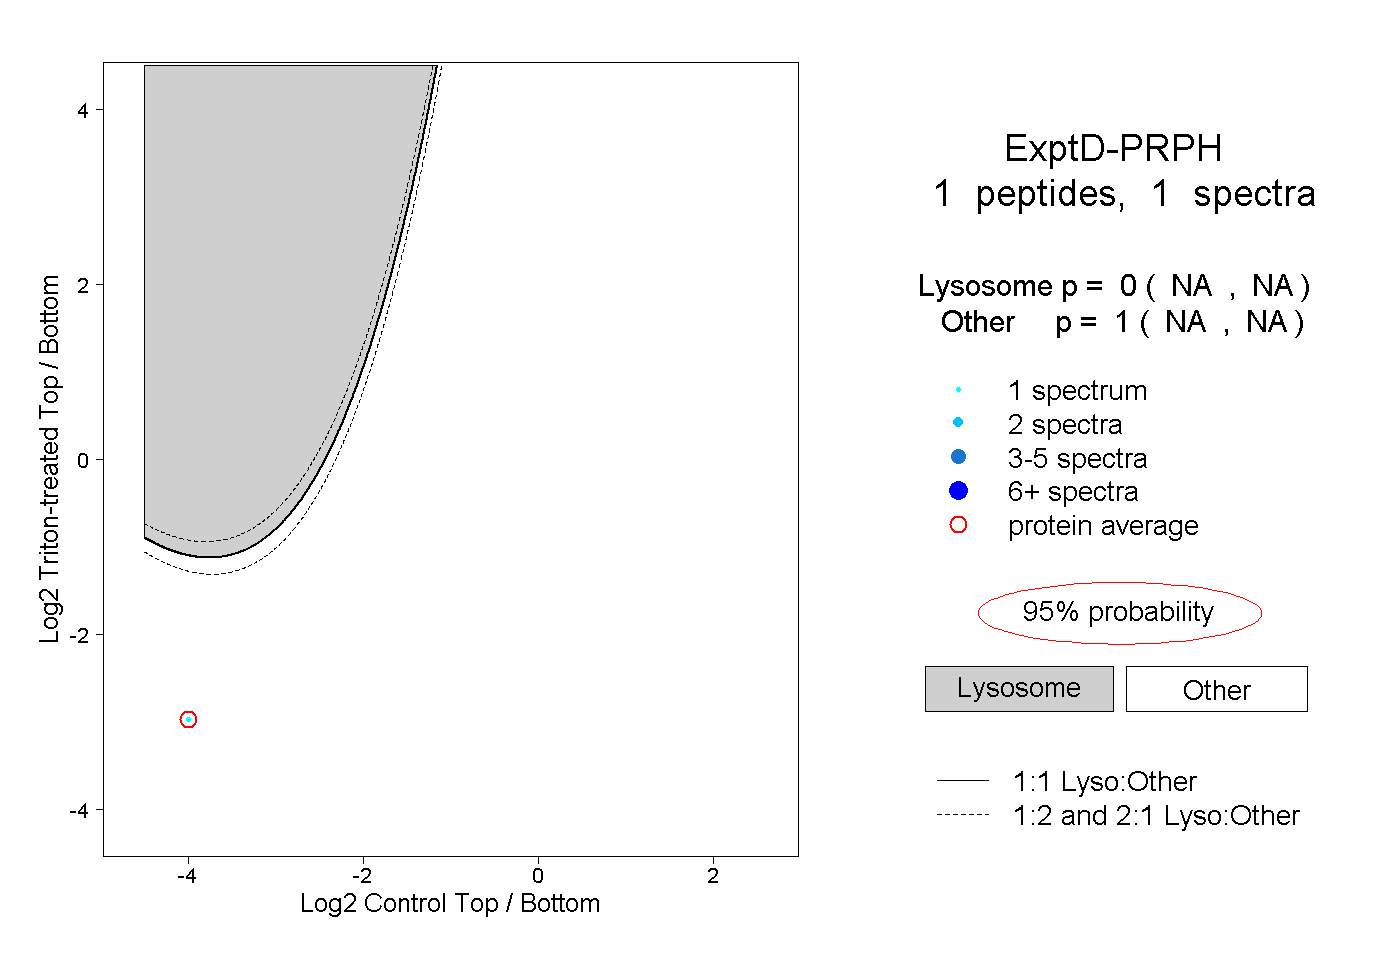
NA | NA
NA | NA