 2
2peptides
spectra
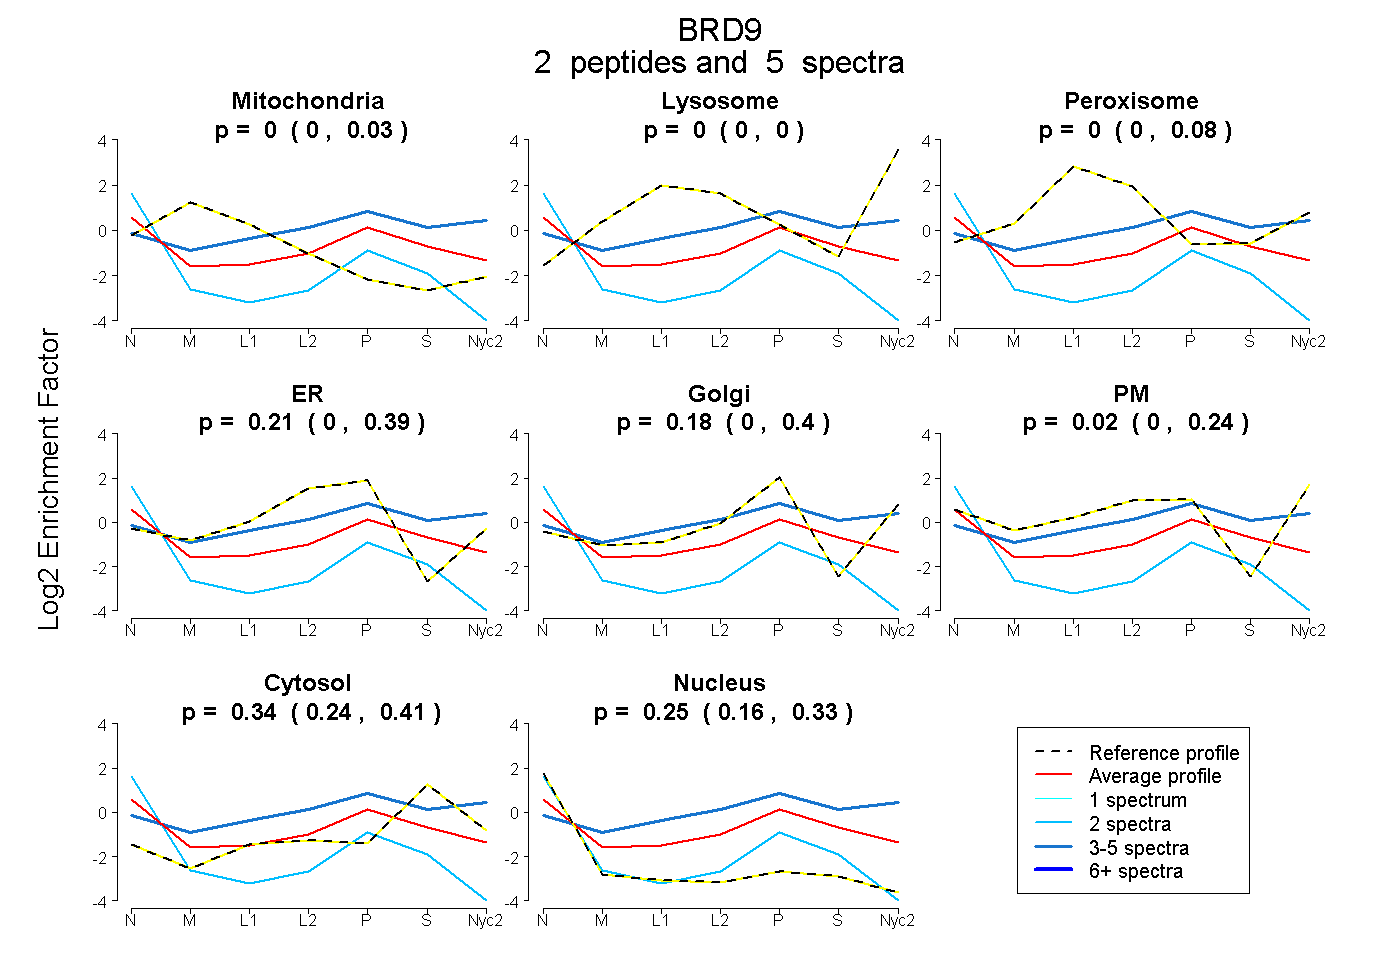
0.000 | 0.031
0.000 | 0.000
0.000 | 0.079
0.000 | 0.393
0.000 | 0.399
0.000 | 0.240
0.238 | 0.410
0.159 | 0.331
1peptide
spectrum
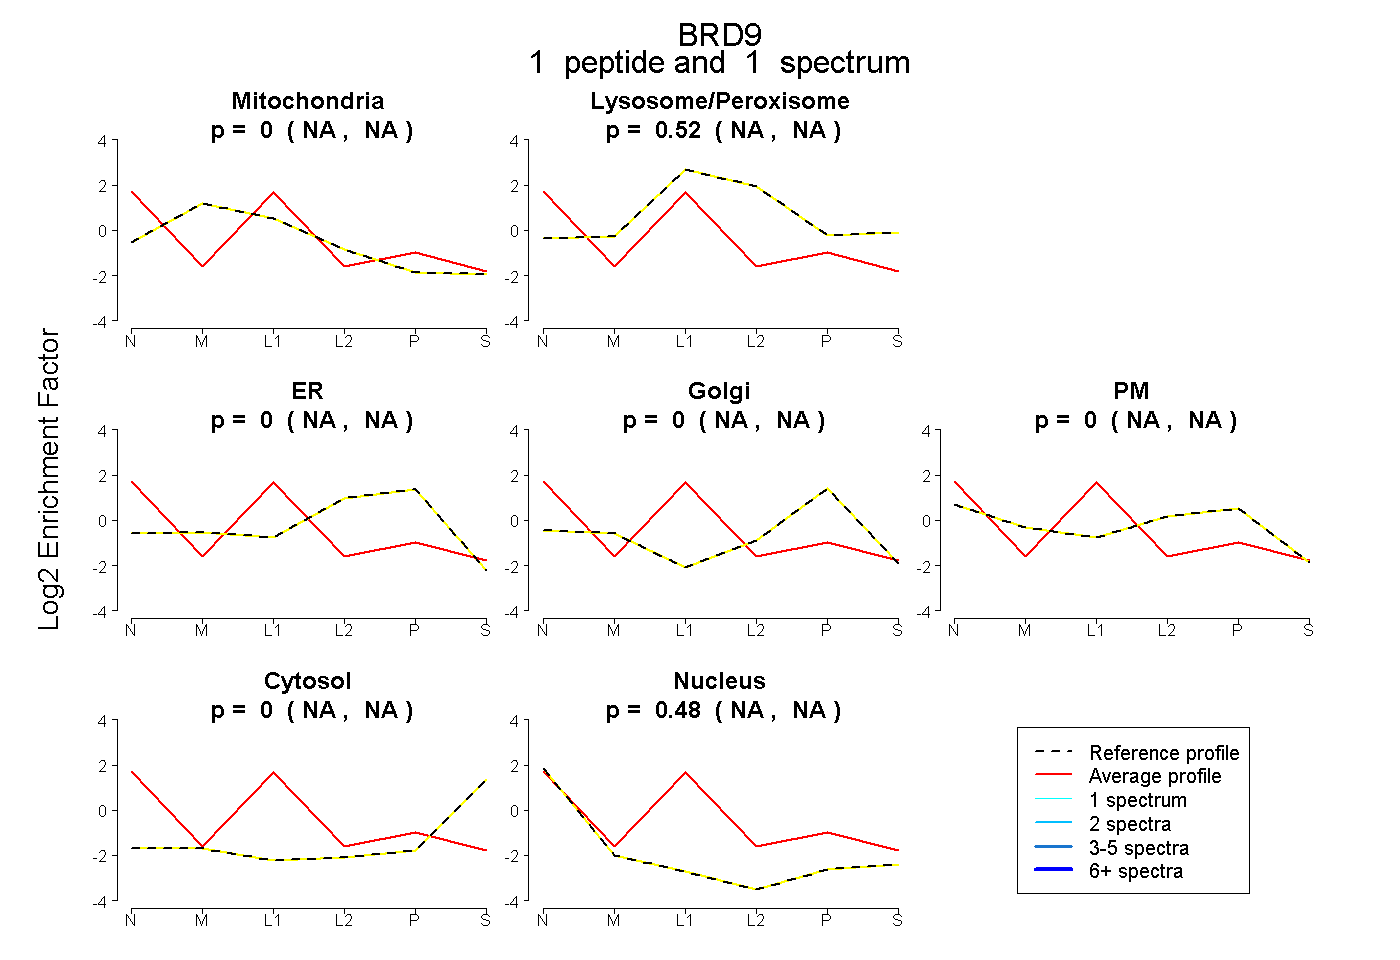
NA | NA
NA | NA
NA | NA
NA | NA
NA | NA
NA | NA
NA | NA
1peptide
spectra
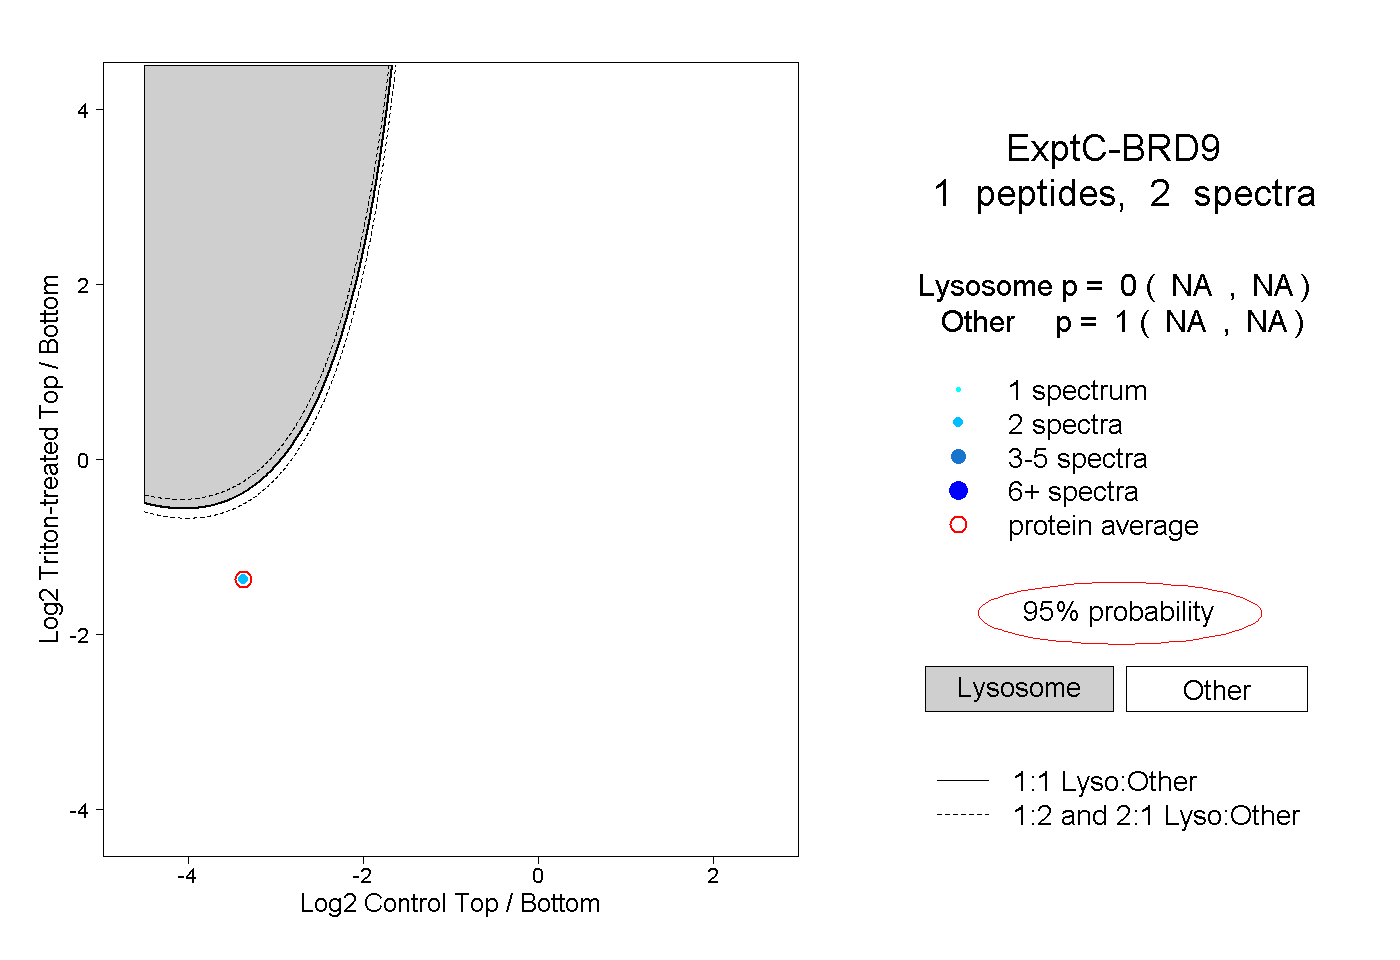
NA | NA
NA | NA