 4
4peptides
spectra
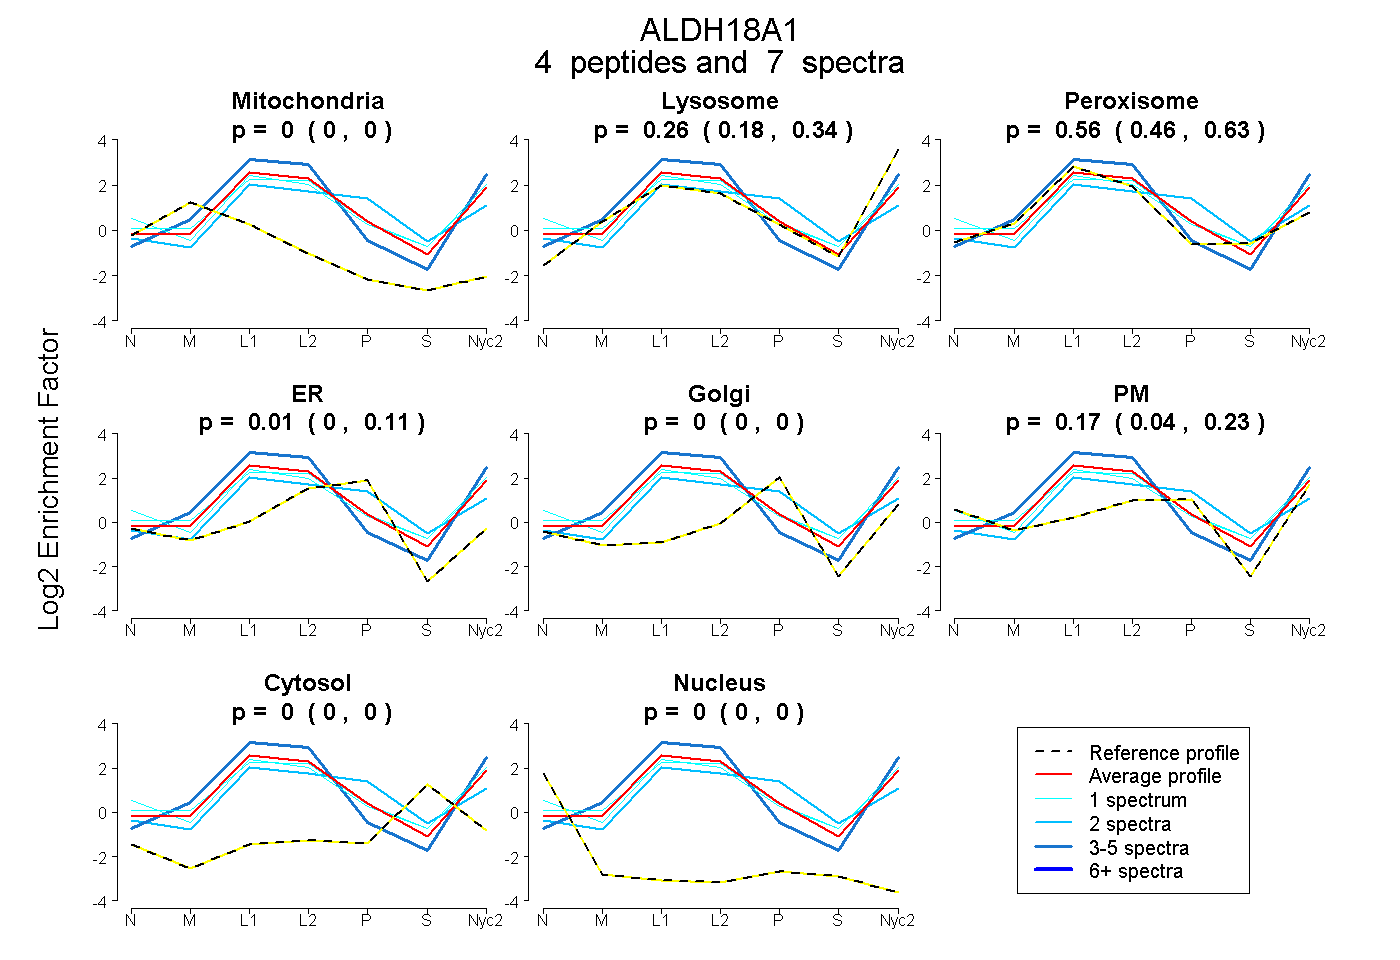
0.000 | 0.000
0.181 | 0.339
0.457 | 0.632
0.000 | 0.107
0.000 | 0.000
0.038 | 0.229
0.000 | 0.000
0.000 | 0.000
2peptides
spectra
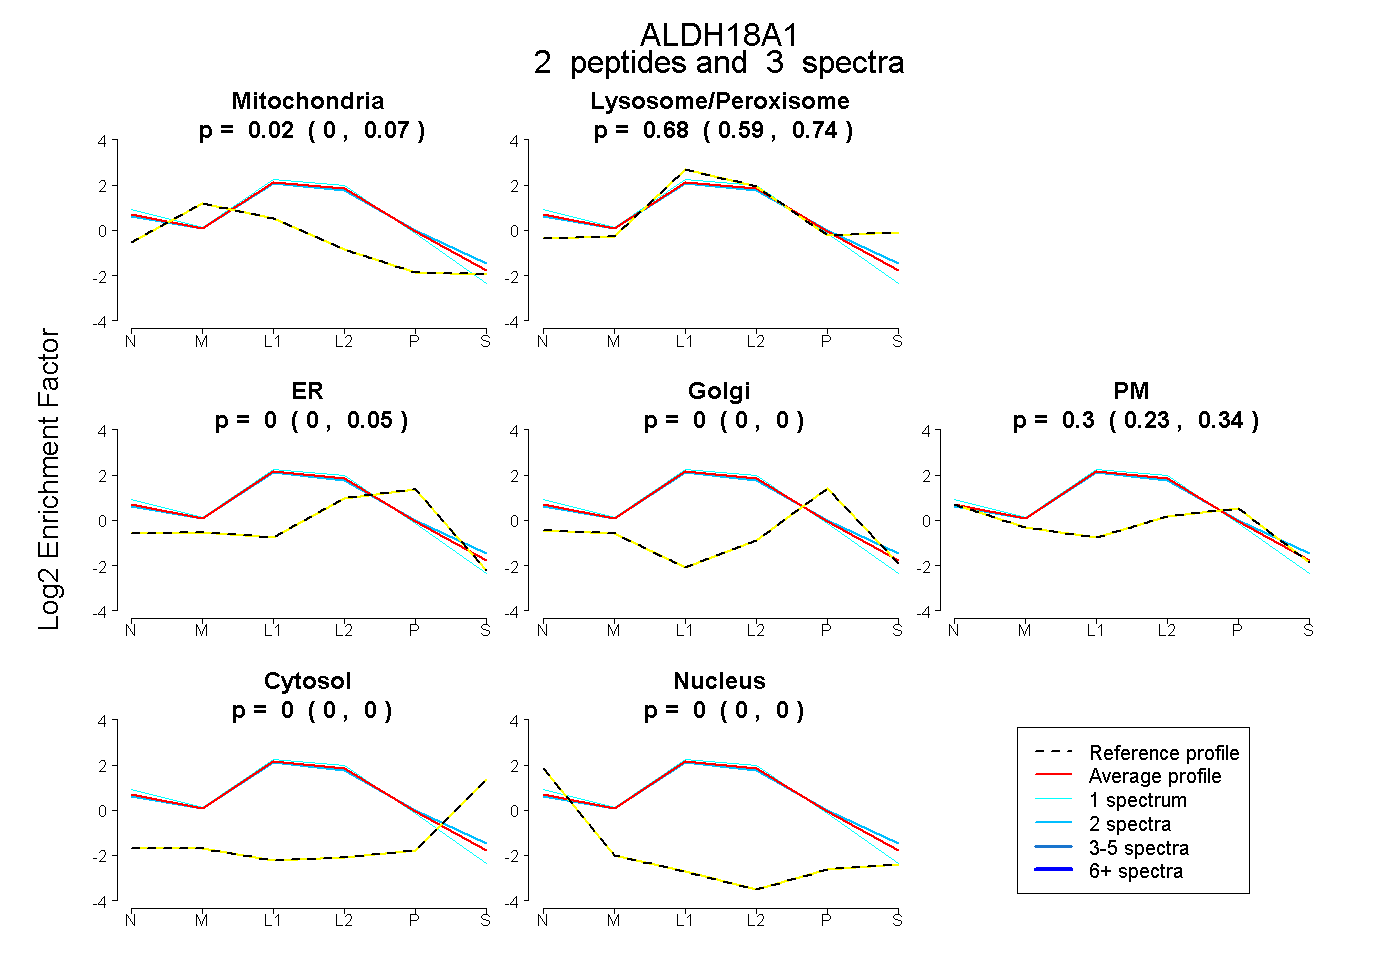
0.000 | 0.068
0.586 | 0.743
0.000 | 0.048
0.000 | 0.000
0.228 | 0.339
0.000 | 0.000
0.000 | 0.000
24peptides
spectra
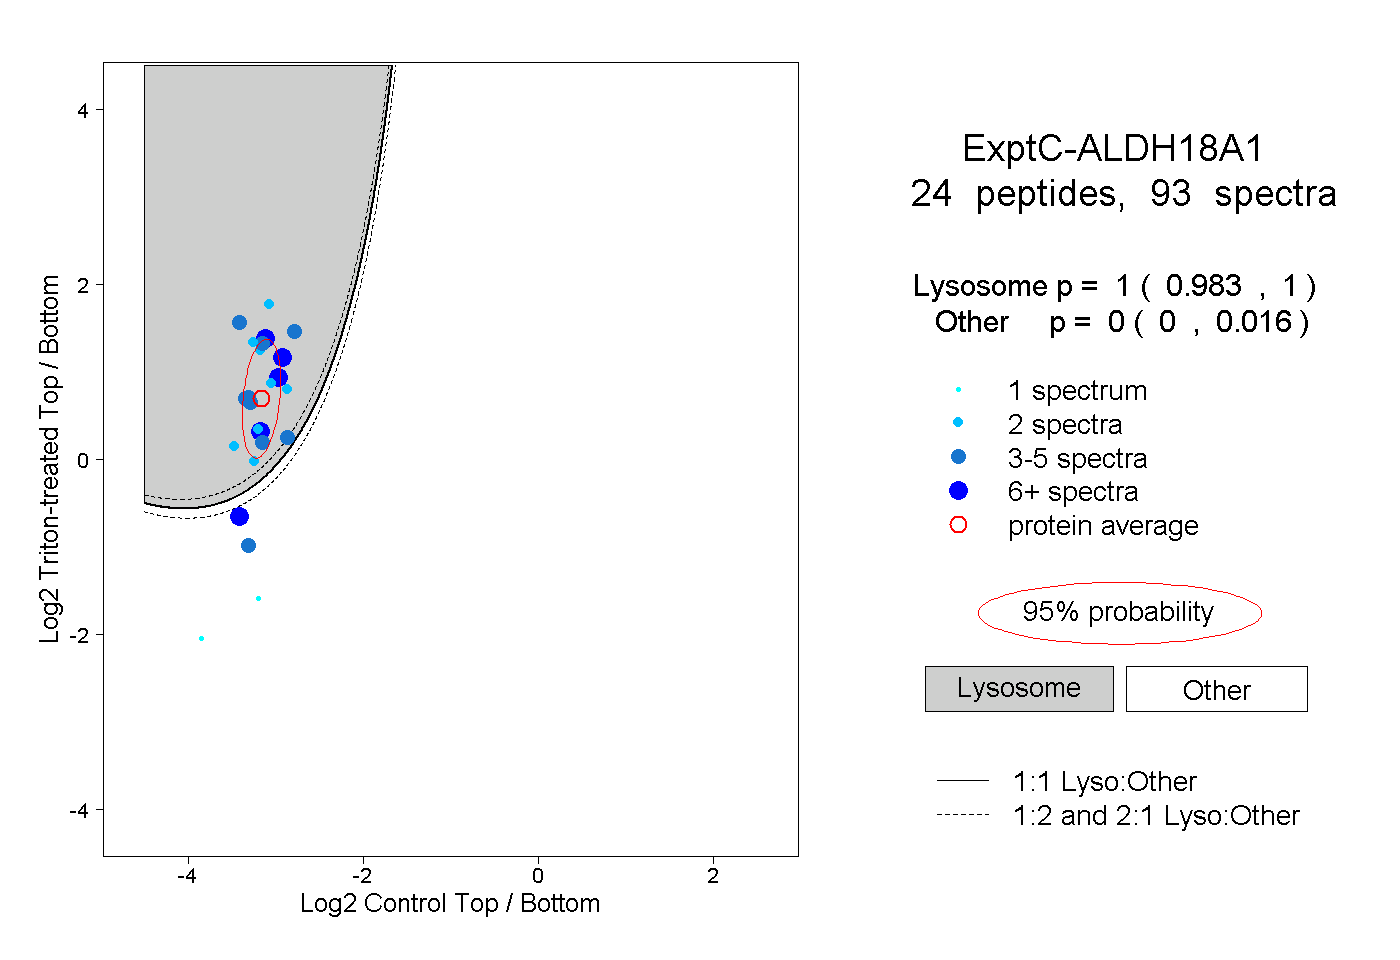
0.983 | 1.000
0.000 | 0.016
5peptides
spectra
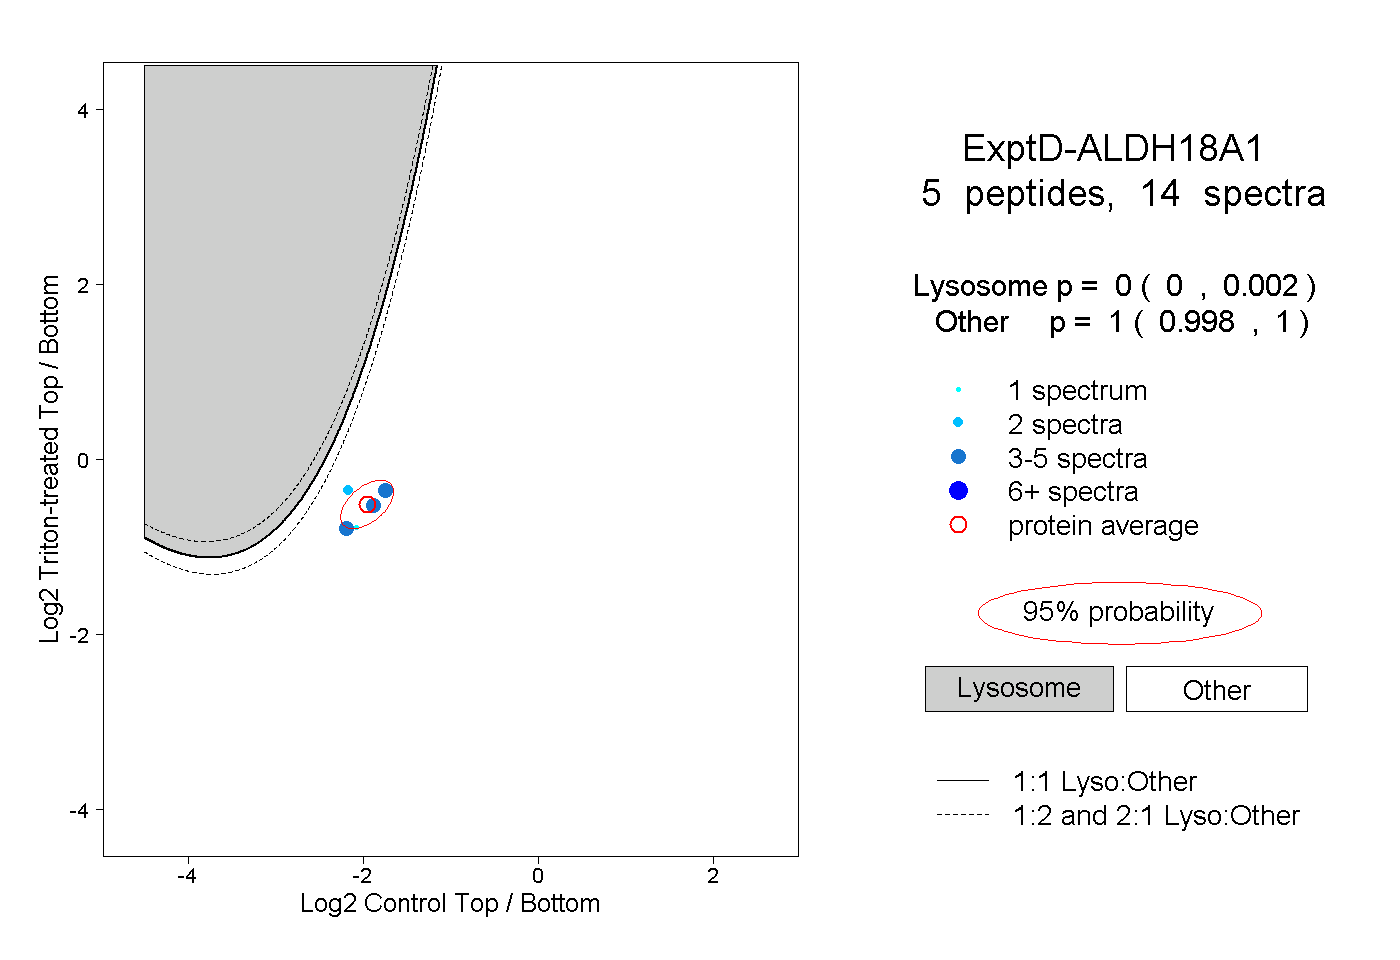
0.000 | 0.002
0.998 | 1.000