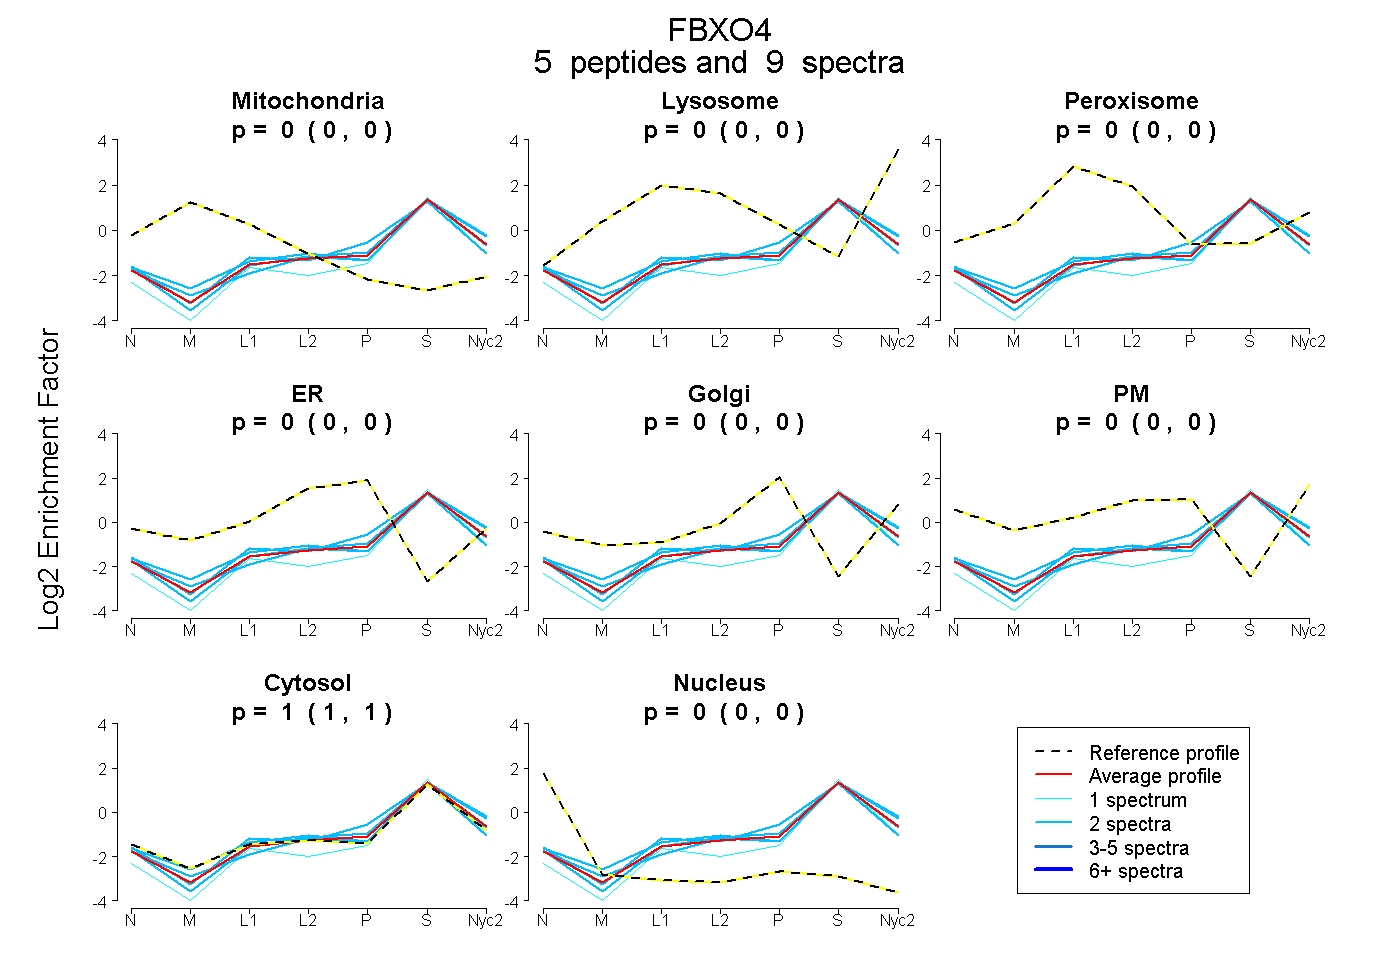
 5
5peptides
spectra
0.000 | 0.000
0.000 | 0.000
0.000 | 0.000
0.000 | 0.000
0.000 | 0.000
0.000 | 0.000
0.997 | 1.000
0.000 | 0.000
| Plot | Mito | Lyso | Perox | ER | Golgi | PM | Cytosol | Nucleus | |||||
| Expt A |
5 peptides |
9 spectra |
|
0.000 0.000 | 0.000 |
0.000 0.000 | 0.000 |
0.000 0.000 | 0.000 |
0.000 0.000 | 0.000 |
0.000 0.000 | 0.000 |
0.000 0.000 | 0.000 |
1.000 0.997 | 1.000 |
0.000 0.000 | 0.000 |
| 2 spectra, HEWQDEFSR | 0.000 | 0.000 | 0.000 | 0.000 | 0.000 | 0.000 | 1.000 | 0.000 | ||
| 2 spectra, EEAEETSALTR | 0.000 | 0.000 | 0.000 | 0.000 | 0.012 | 0.000 | 0.988 | 0.000 | ||
| 1 spectrum, DLPSWSSVDWK | 0.000 | 0.000 | 0.000 | 0.000 | 0.000 | 0.000 | 1.000 | 0.000 | ||
| 2 spectra, LEAAILSGWR | 0.000 | 0.057 | 0.000 | 0.000 | 0.000 | 0.000 | 0.943 | 0.000 | ||
| 2 spectra, MPCFYLAHELR | 0.000 | 0.000 | 0.000 | 0.009 | 0.030 | 0.000 | 0.961 | 0.000 |
| Plot | Lyso | Other | |||||||||||
| Expt C |
1 peptide |
1 spectrum |
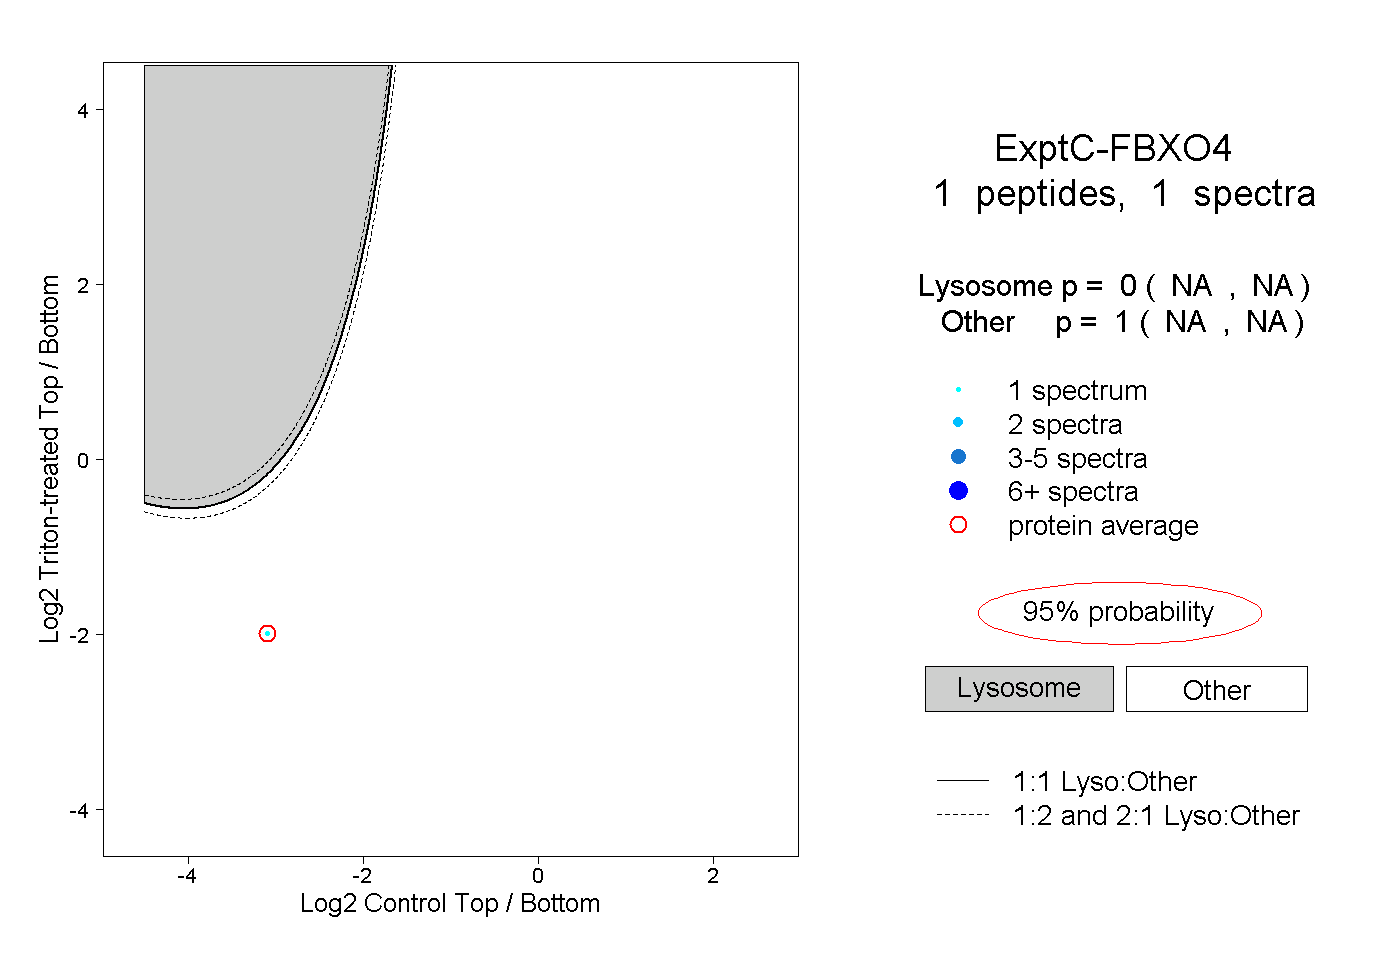 |
0.000 NA | NA |
1.000 NA | NA |