7
7peptides
spectra
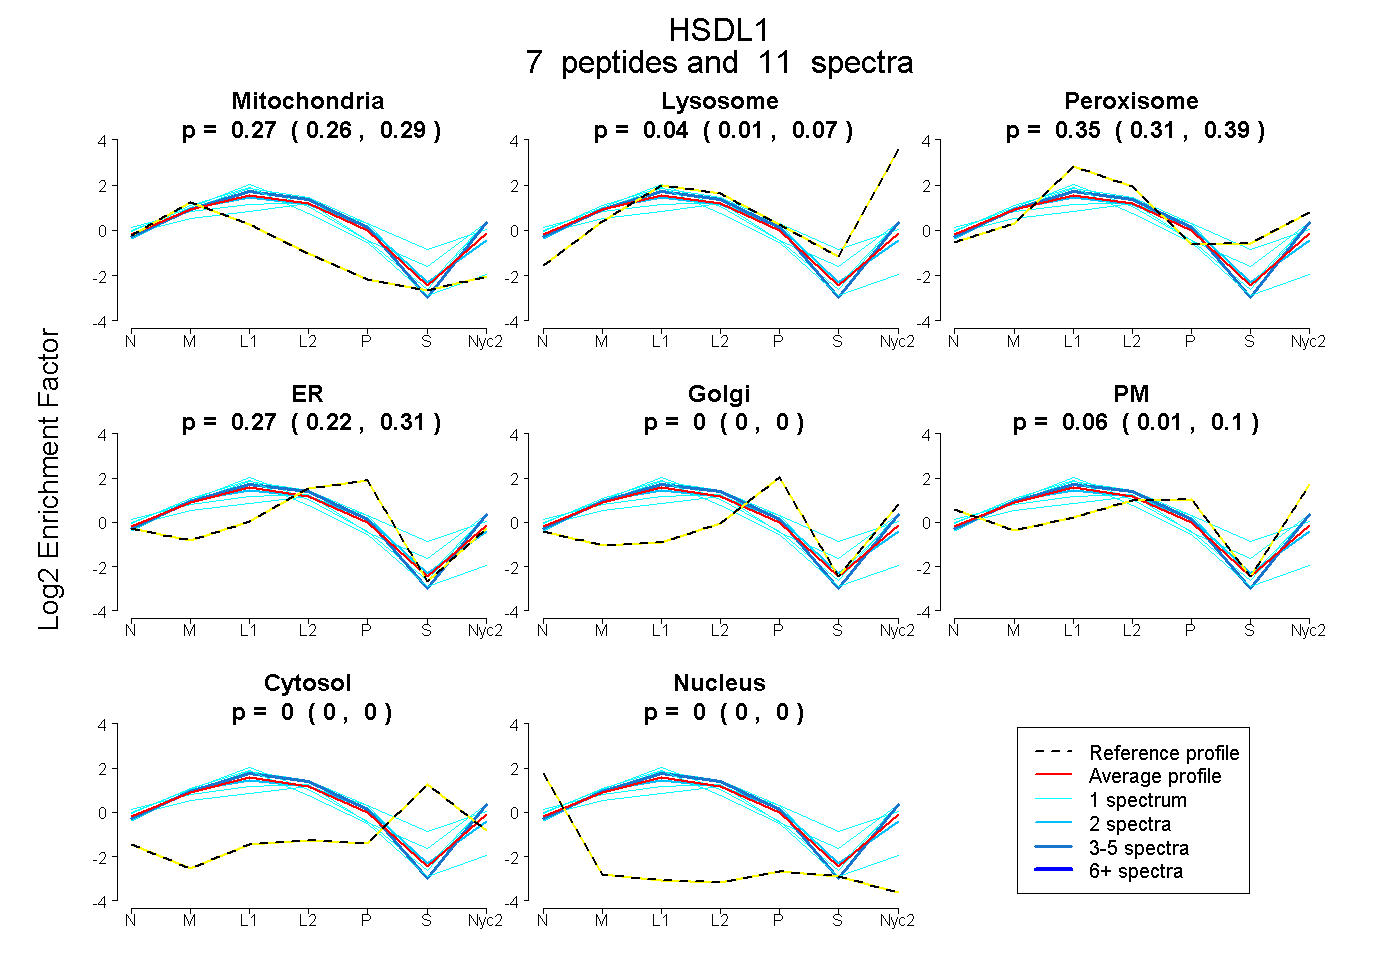
0.256 | 0.290
0.006 | 0.071
0.308 | 0.393
0.220 | 0.307
0.000 | 0.000
0.014 | 0.103
0.000 | 0.000
0.000 | 0.000
2peptides
spectra
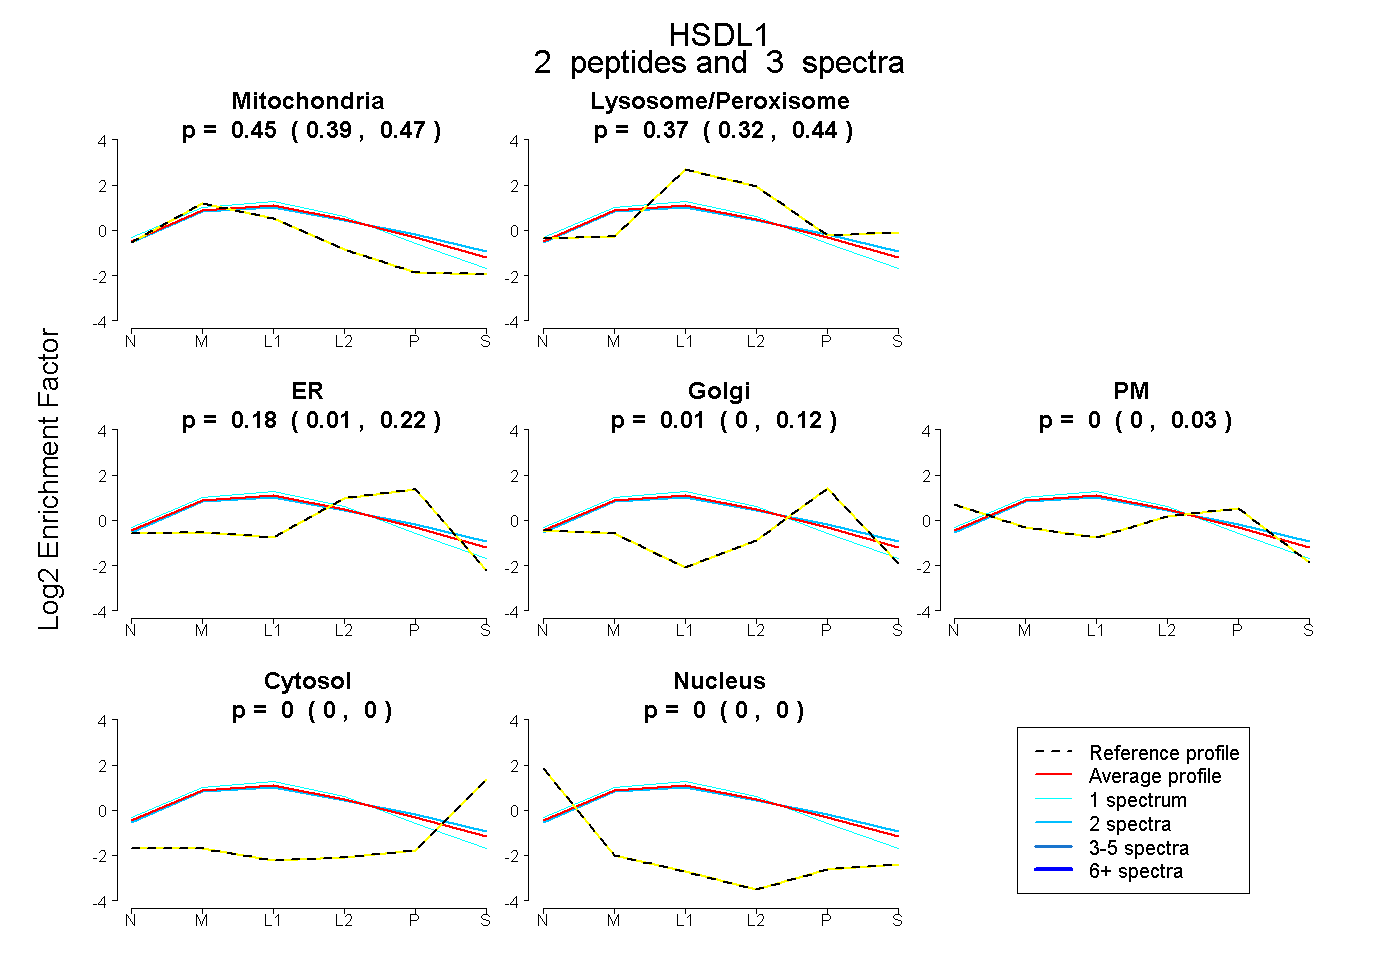
0.387 | 0.473
0.322 | 0.441
0.011 | 0.218
0.000 | 0.123
0.000 | 0.027
0.000 | 0.000
0.000 | 0.000
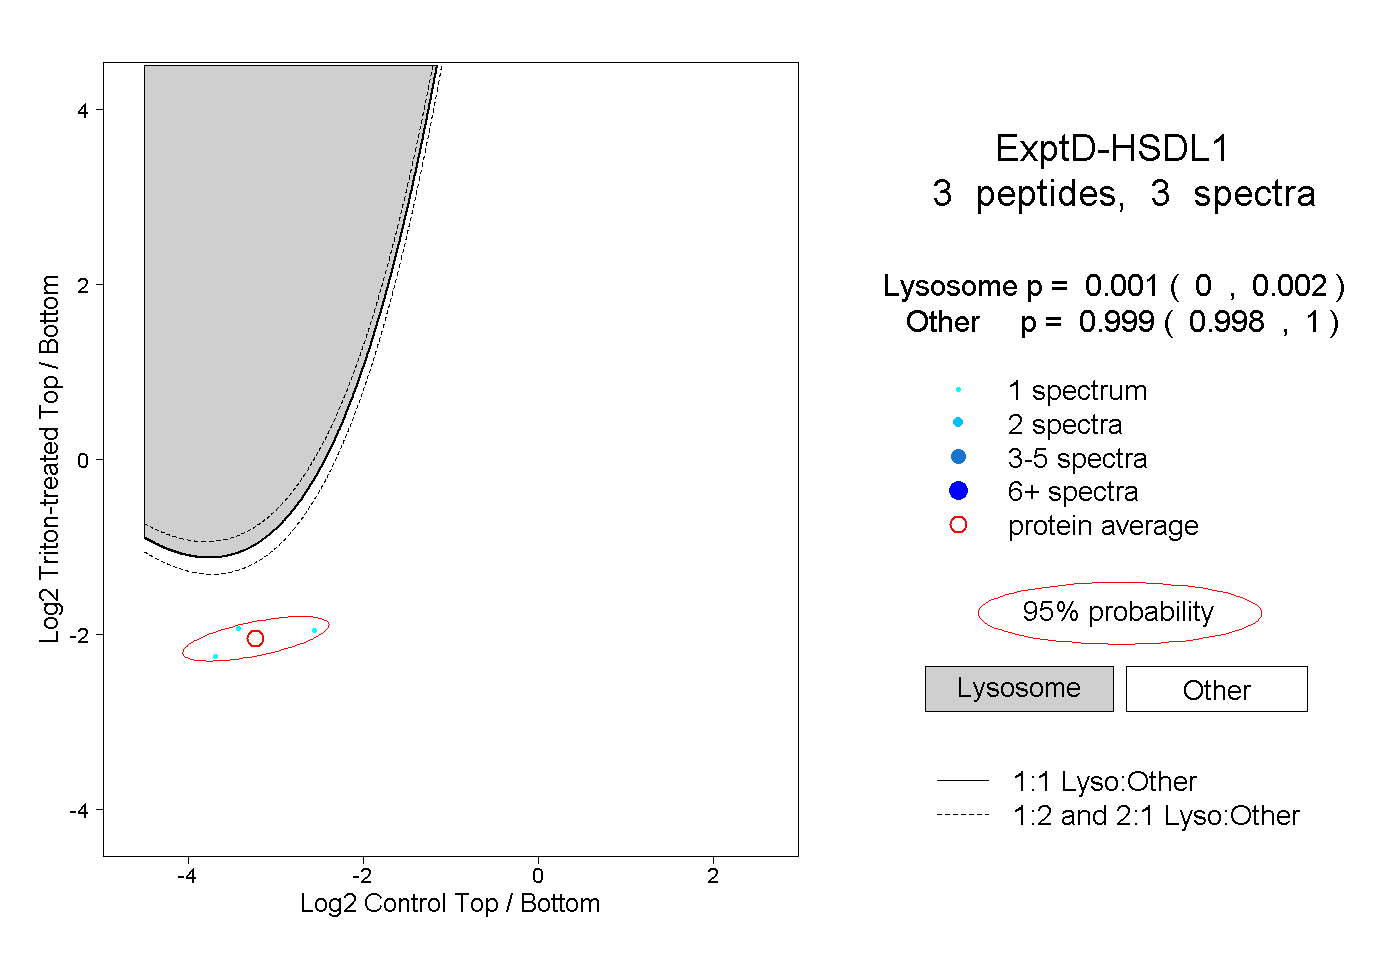
9peptides
spectra
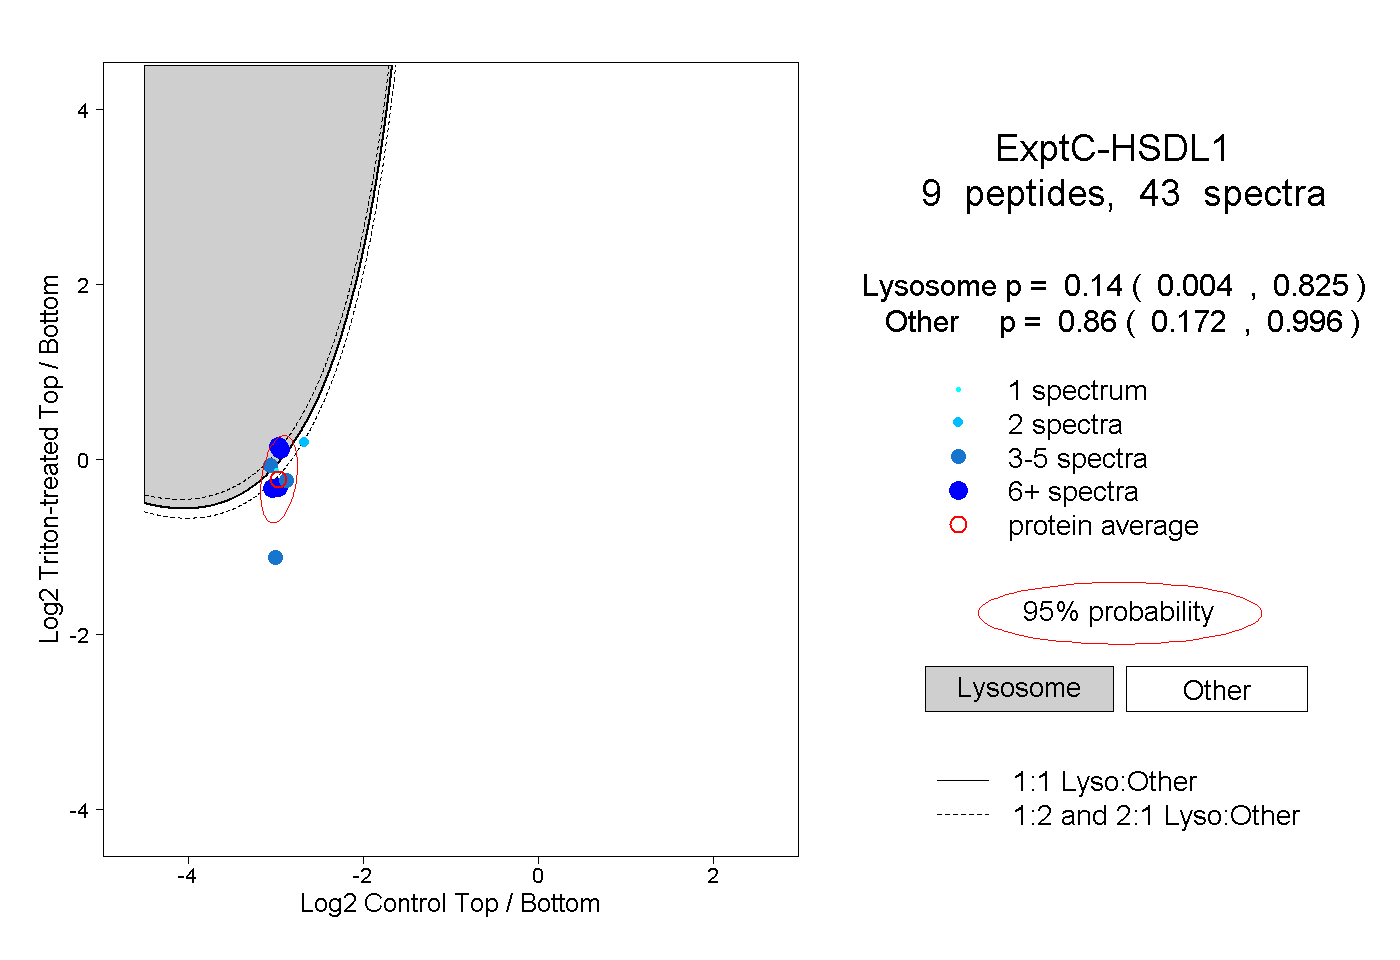
0.004 | 0.825
0.172 | 0.996