 3
3peptides
spectra
0.000 | 0.132
0.000 | 0.019
0.000 | 0.097
0.000 | 0.120
0.000 | 0.203
0.000 | 0.212
0.660 | 0.775
0.000 | 0.013
| Plot | Mito | Lyso | Perox | ER | Golgi | PM | Cytosol | Nucleus | |||||
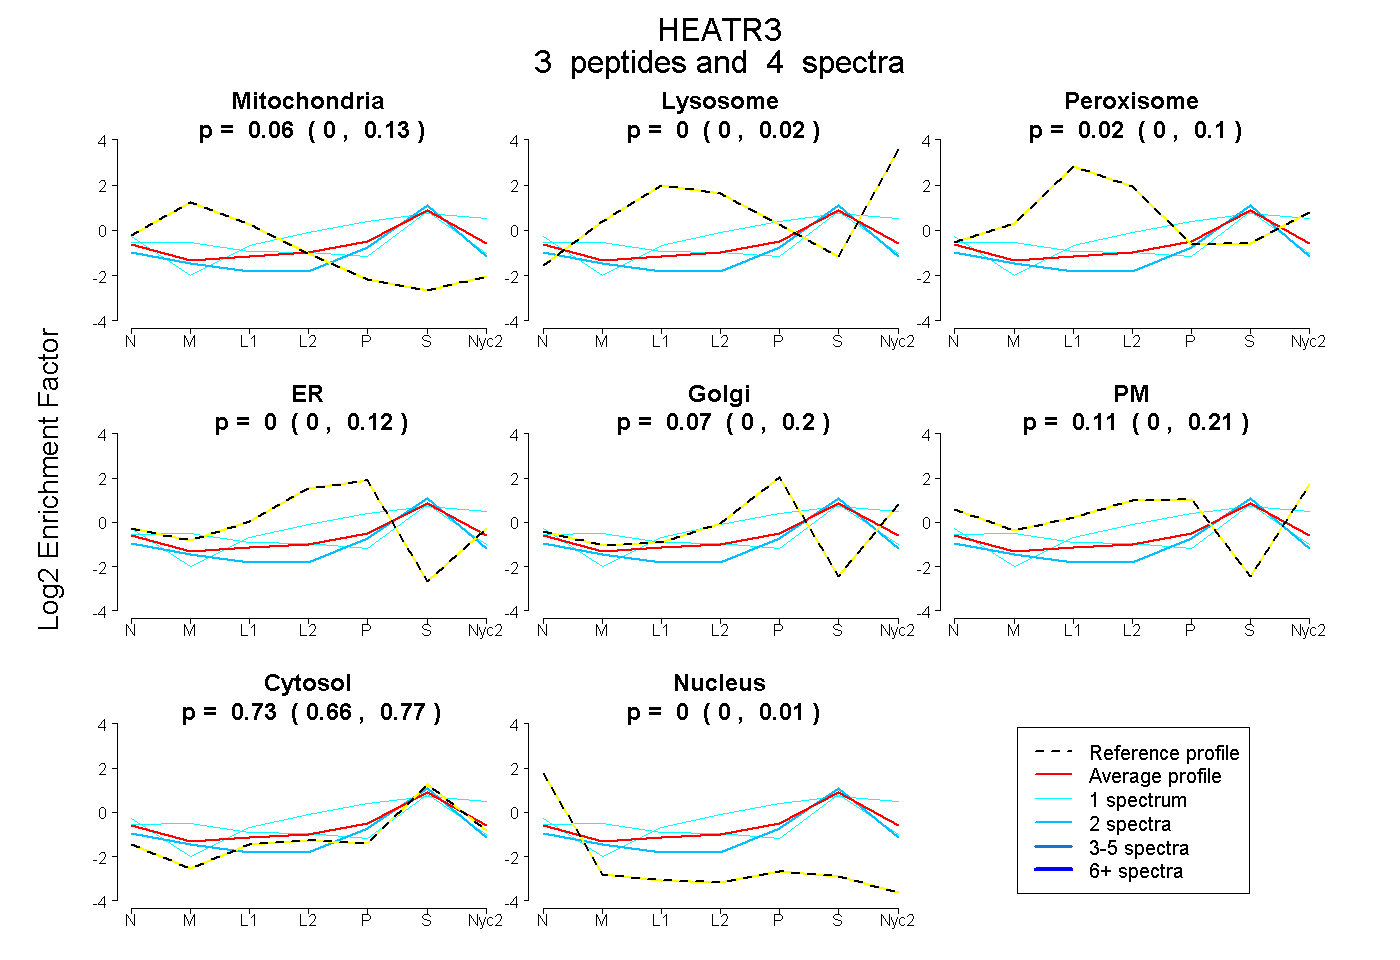
| Expt A |
3 peptides |
4 spectra |
|
0.057 0.000 | 0.132 |
0.000 0.000 | 0.019 |
0.025 0.000 | 0.097 |
0.000 0.000 | 0.120 |
0.073 0.000 | 0.203 |
0.114 0.000 | 0.212 |
0.732 0.660 | 0.775 |
0.000 0.000 | 0.013 |
| 1 spectrum, EDGTLETLK | 0.000 | 0.057 | 0.000 | 0.000 | 0.045 | 0.308 | 0.590 | 0.000 | ||
| 2 spectra, LVQQRPALPDLAR | 0.065 | 0.000 | 0.000 | 0.000 | 0.062 | 0.000 | 0.827 | 0.046 | ||
| 1 spectrum, HADFLEAISSALR | 0.249 | 0.000 | 0.093 | 0.000 | 0.000 | 0.008 | 0.650 | 0.000 |
| Plot | Lyso | Other | |||||||||||
| Expt D |
1 peptide |
1 spectrum |
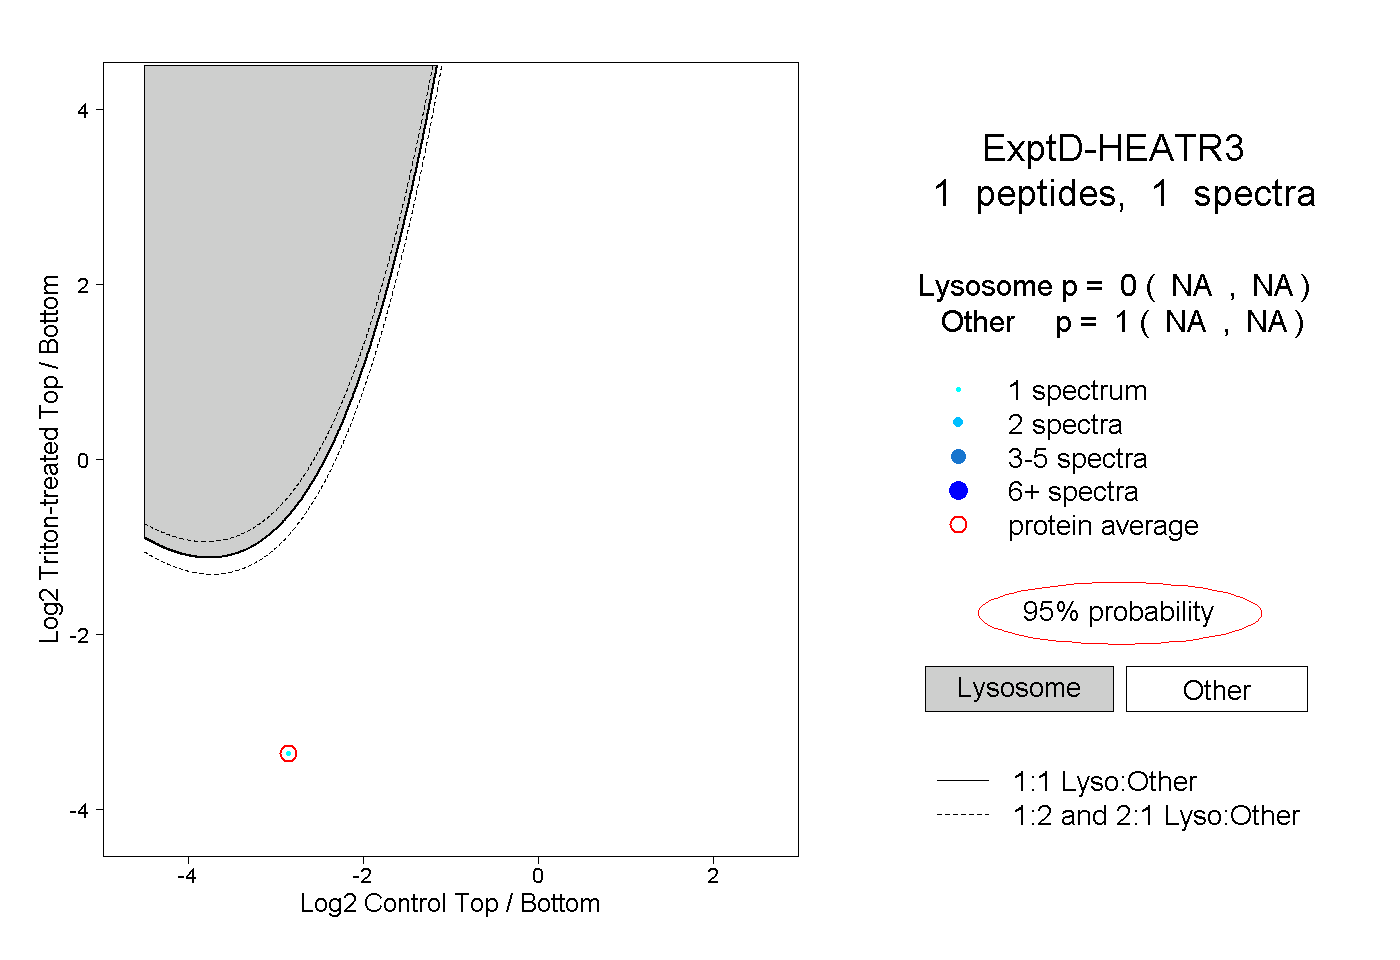 |
0.000 NA | NA |
1.000 NA | NA |