8
8peptides
spectra
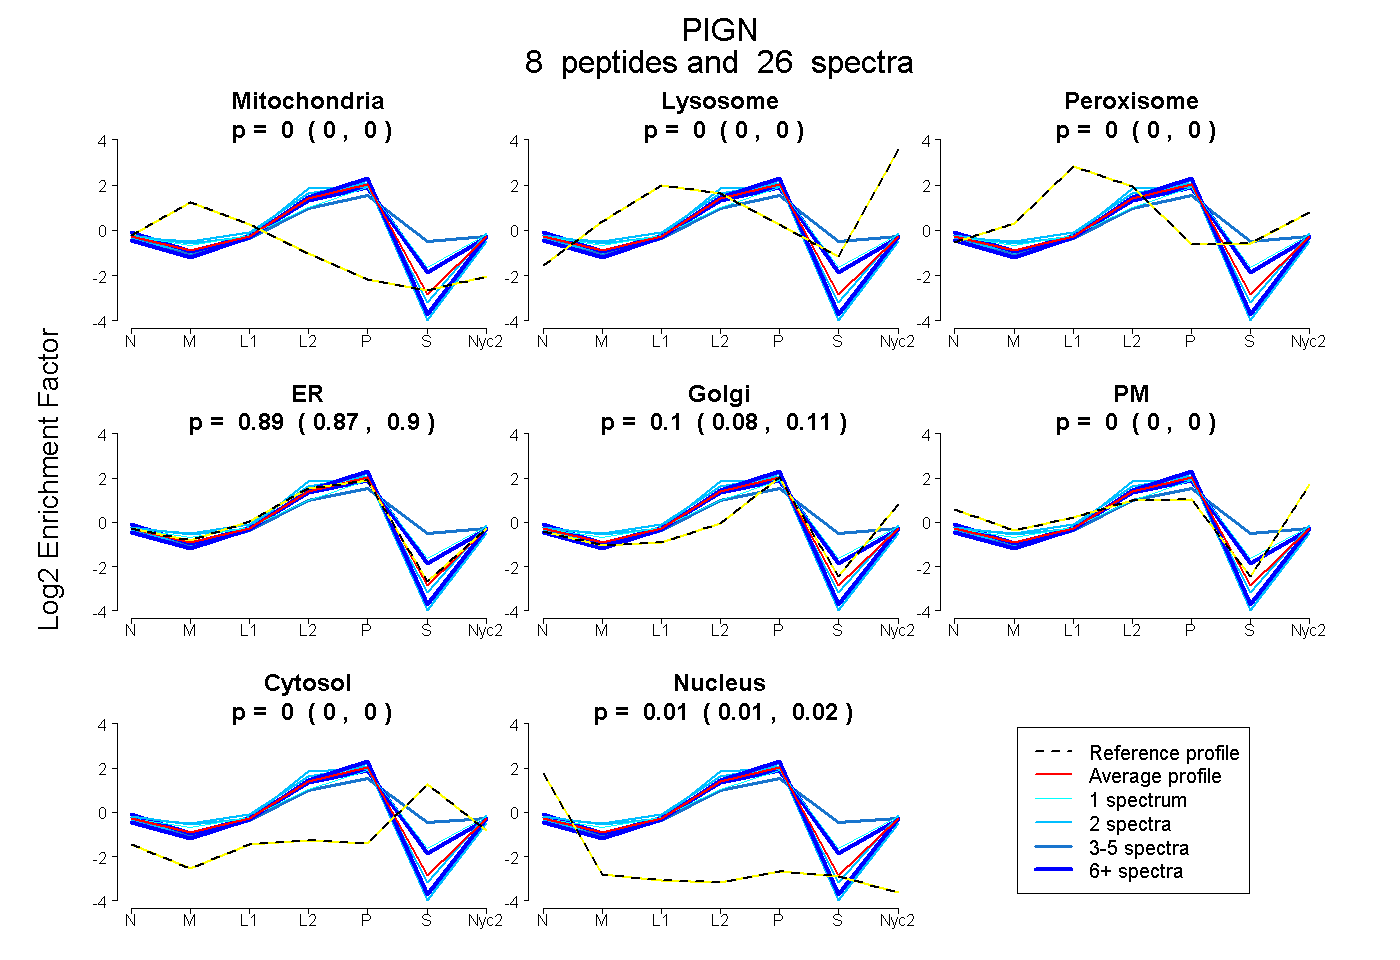
0.000 | 0.000
0.000 | 0.000
0.000 | 0.000
0.874 | 0.905
0.078 | 0.110
0.000 | 0.000
0.000 | 0.000
0.009 | 0.016
6peptides
spectra
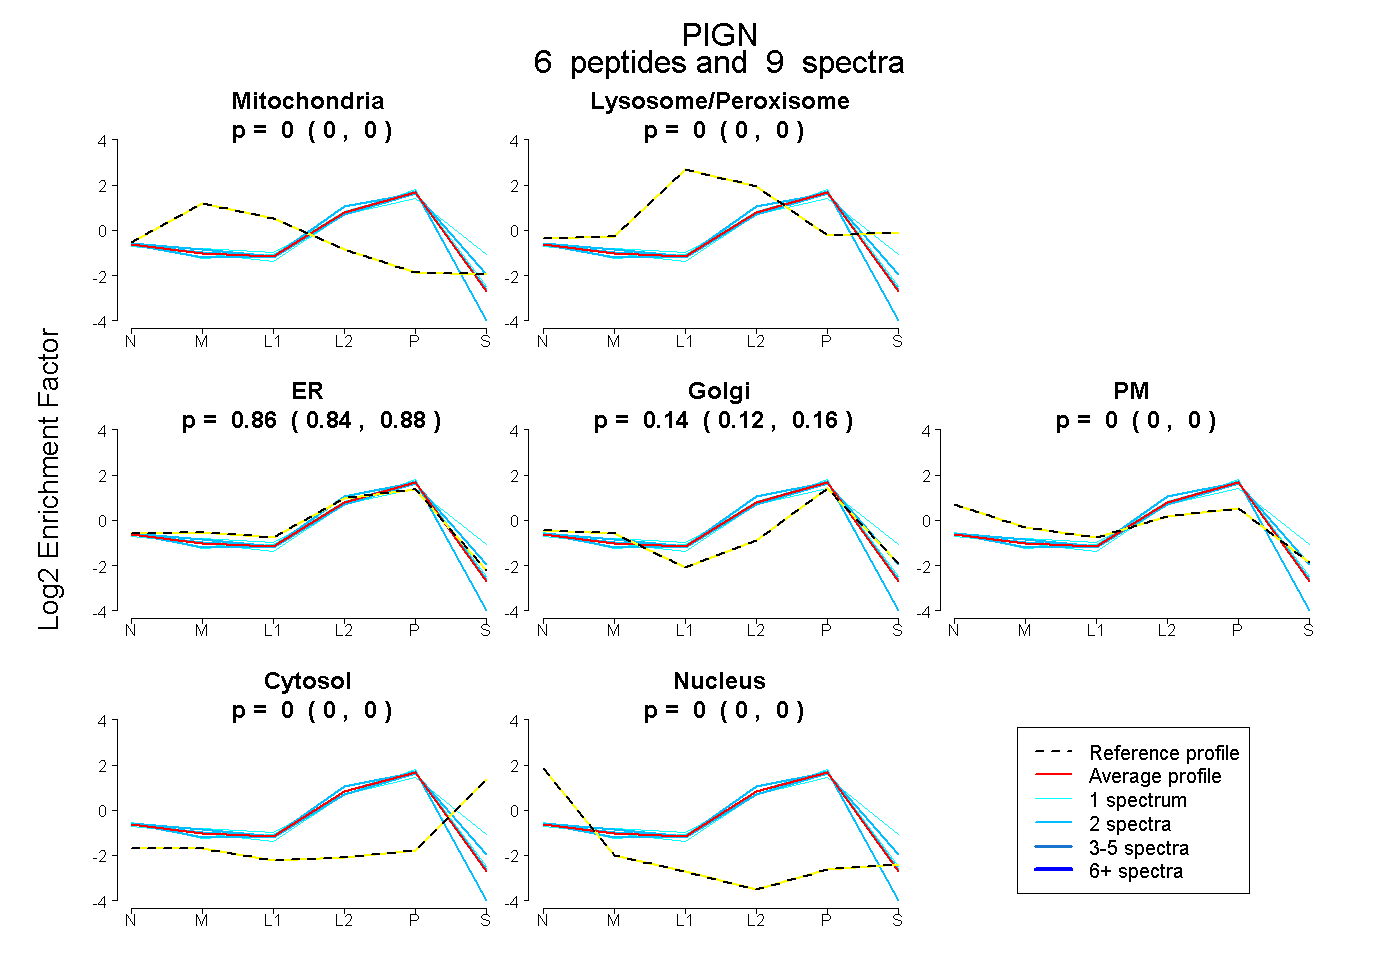
0.000 | 0.000
0.000 | 0.000
0.838 | 0.879
0.118 | 0.158
0.000 | 0.000
0.000 | 0.000
0.000 | 0.000