 8
8peptides
spectra
0.000 | 0.000
0.000 | 0.000
0.000 | 0.000
0.874 | 0.905
0.078 | 0.110
0.000 | 0.000
0.000 | 0.000
0.009 | 0.016
| Plot | Mito | Lyso | Perox | ER | Golgi | PM | Cytosol | Nucleus | |||||
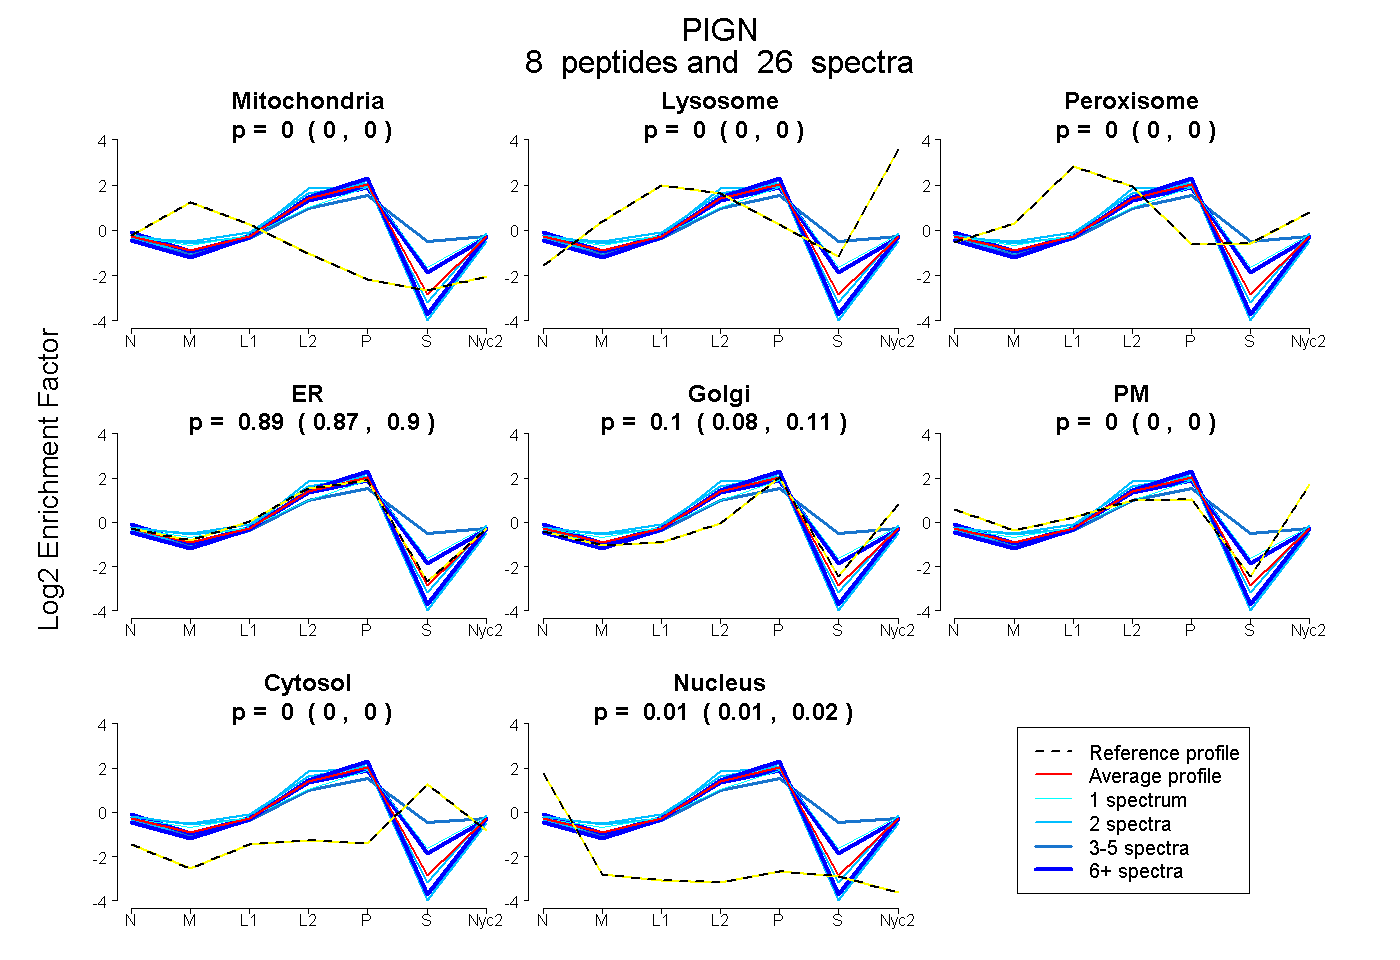
| Expt A |
8 peptides |
26 spectra |
|
0.000 0.000 | 0.000 |
0.000 0.000 | 0.000 |
0.000 0.000 | 0.000 |
0.891 0.874 | 0.905 |
0.096 0.078 | 0.110 |
0.000 0.000 | 0.000 |
0.000 0.000 | 0.000 |
0.013 0.009 | 0.016 |
| 2 spectra, ADALYELDEDGNSR | 0.000 | 0.000 | 0.000 | 0.978 | 0.000 | 0.000 | 0.000 | 0.022 | ||
| 8 spectra, HFYEDDGK | 0.000 | 0.000 | 0.000 | 0.866 | 0.032 | 0.000 | 0.102 | 0.000 | ||
| 2 spectra, EIVSIFK | 0.000 | 0.000 | 0.000 | 0.949 | 0.051 | 0.000 | 0.000 | 0.000 | ||
| 2 spectra, DFFDAAR | 0.000 | 0.000 | 0.000 | 1.000 | 0.000 | 0.000 | 0.000 | 0.000 | ||
| 1 spectrum, SHSDIPR | 0.000 | 0.000 | 0.040 | 0.673 | 0.184 | 0.000 | 0.102 | 0.000 | ||
| 6 spectra, LVLFVADGLR | 0.000 | 0.000 | 0.000 | 0.901 | 0.098 | 0.000 | 0.000 | 0.001 | ||
| 3 spectra, EDFGAHDATK | 0.000 | 0.000 | 0.058 | 0.633 | 0.021 | 0.000 | 0.287 | 0.000 | ||
| 2 spectra, LDTWVFDK | 0.000 | 0.000 | 0.000 | 0.990 | 0.000 | 0.010 | 0.000 | 0.000 |
| Plot | Mito | Lyso or Perox | ER | Golgi | PM | Cytosol | Nucleus | ||||||
| Expt B |
6 peptides |
9 spectra |
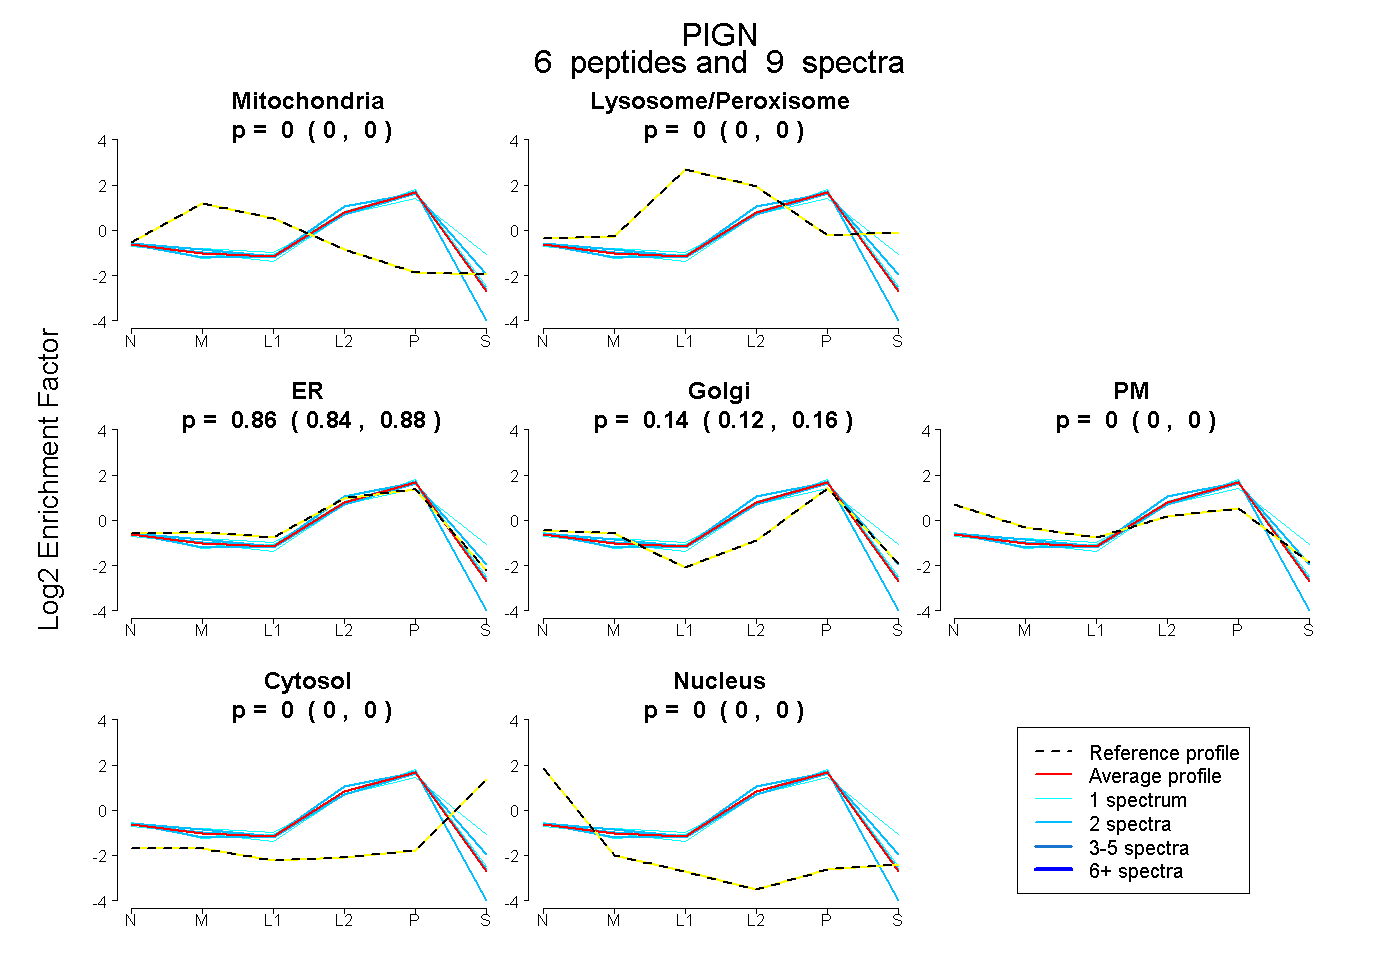 |
0.000 0.000 | 0.000 |
0.000 0.000 | 0.000 |
0.860 0.838 | 0.879 |
0.140 0.118 | 0.158 |
0.000 0.000 | 0.000 |
0.000 0.000 | 0.000 |
0.000 0.000 | 0.000 |
|||
| Plot | Lyso | Other | |||||||||||
| Expt C |
9 peptides |
41 spectra |
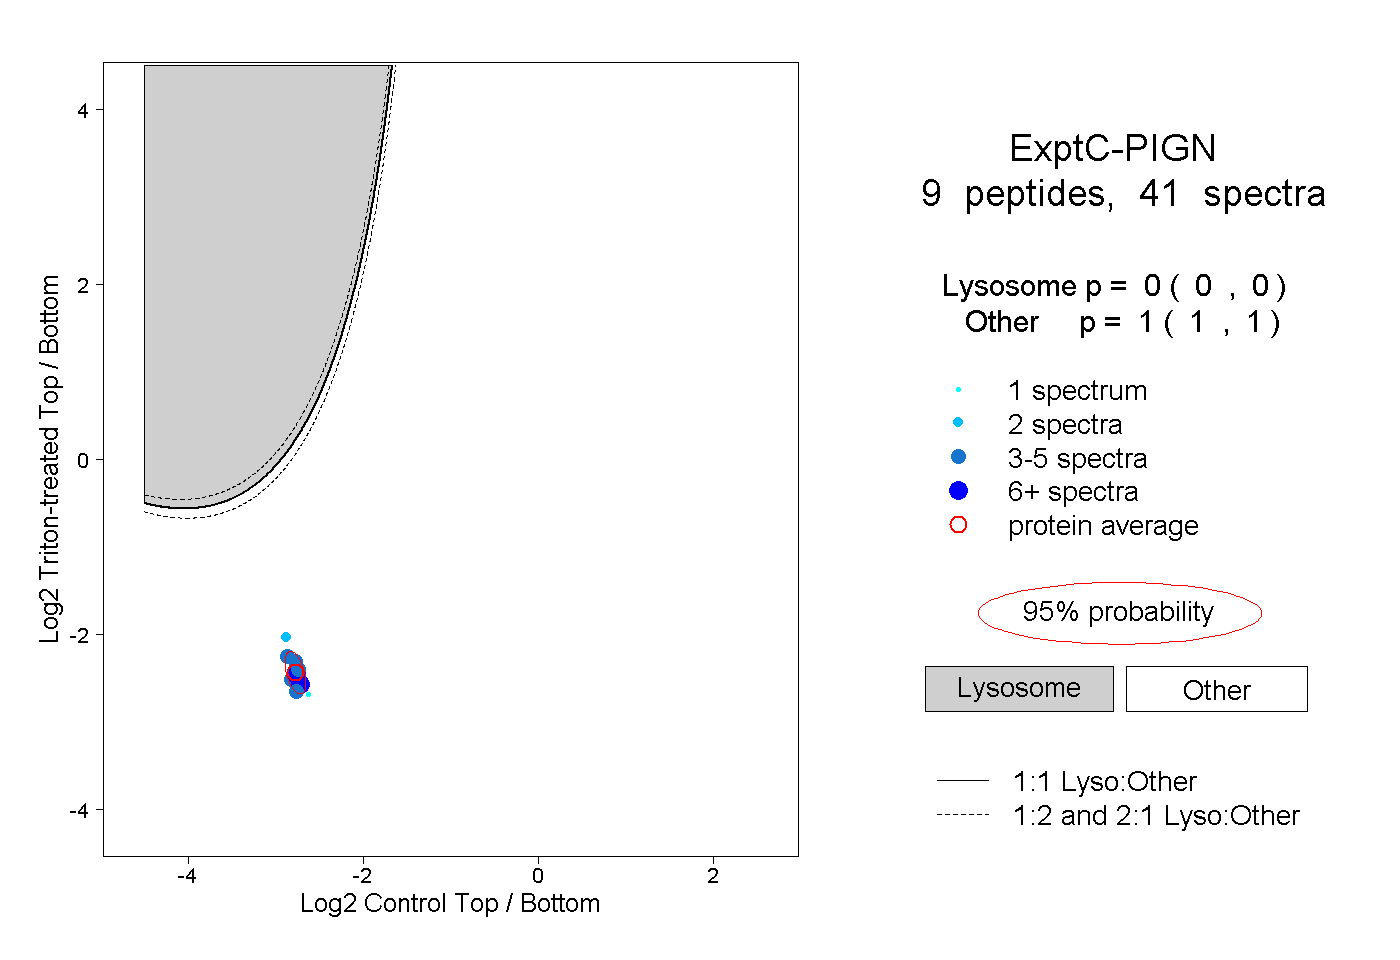 |
0.000 0.000 | 0.000 |
1.000 1.000 | 1.000 |
||||||||
| Plot | Lyso | Other | |||||||||||
| Expt D |
3 peptides |
4 spectra |
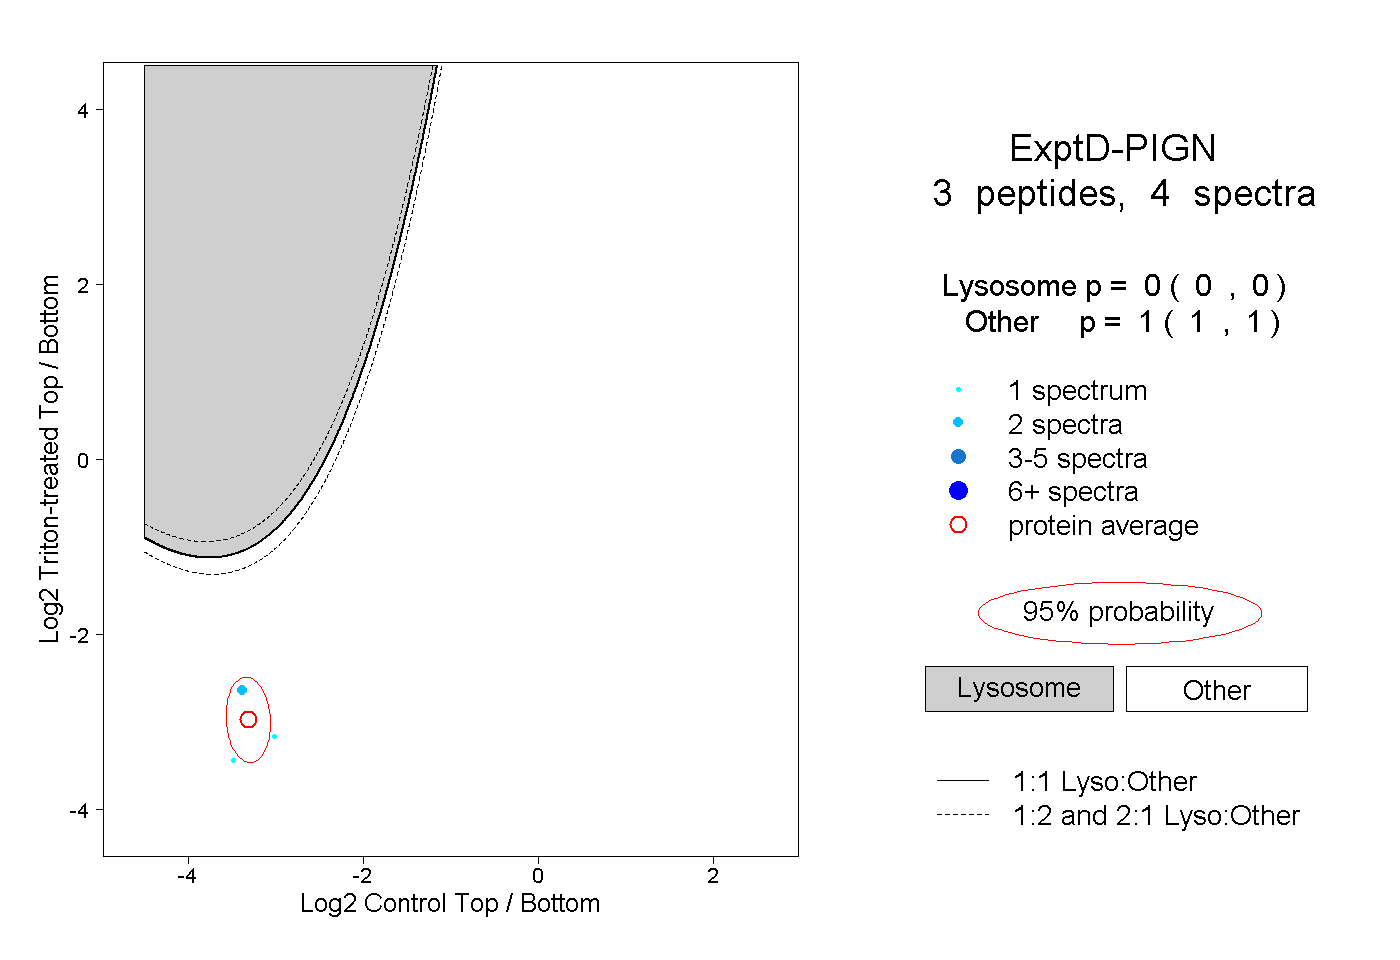 |
0.000 0.000 | 0.000 |
1.000 1.000 | 1.000 |