 15
15peptides
spectra
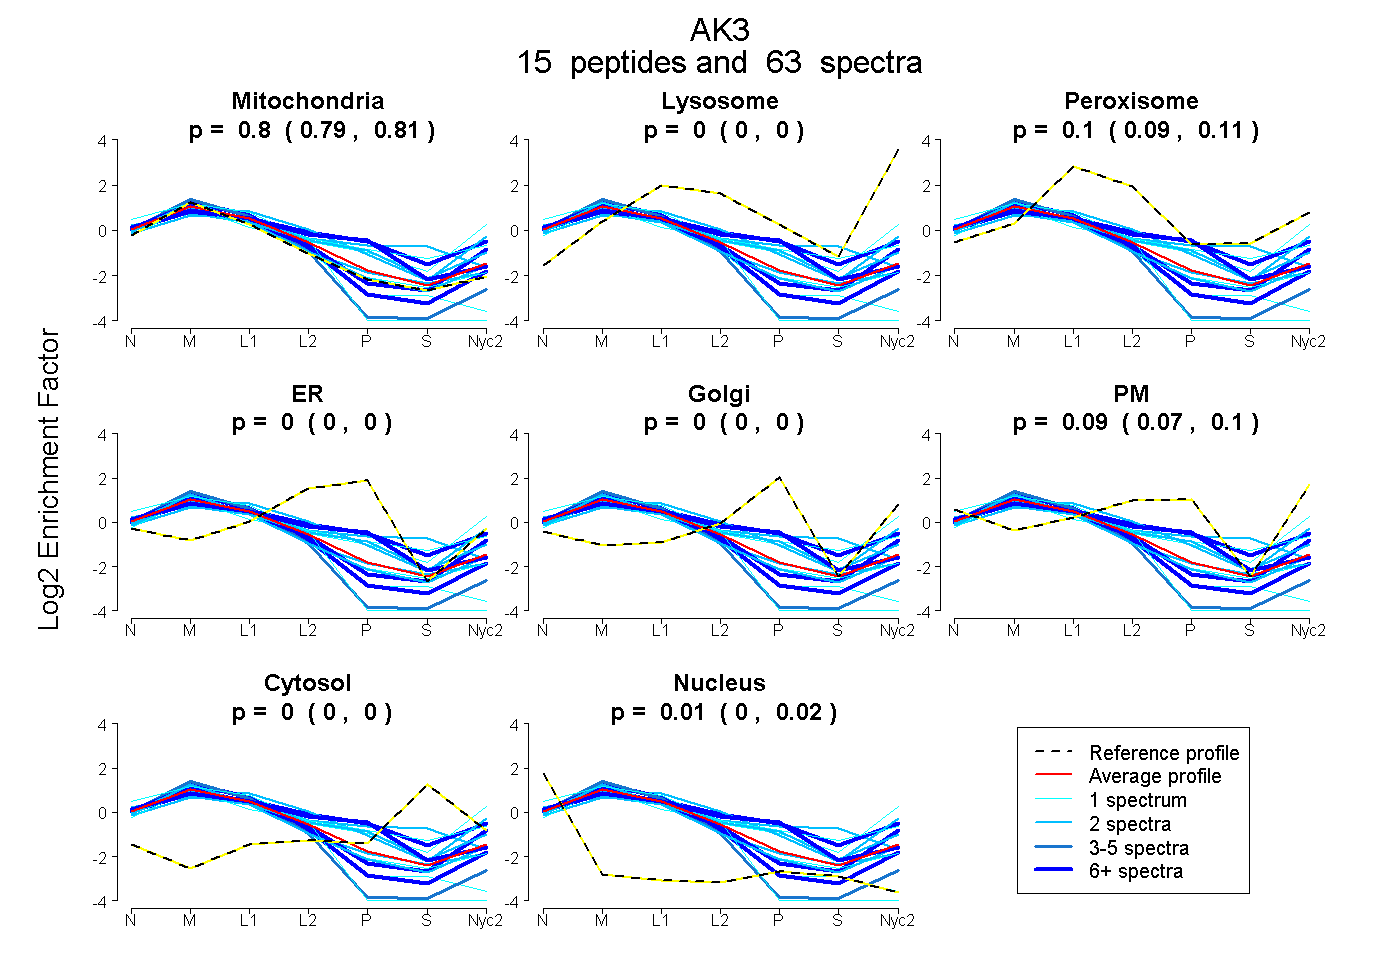
0.792 | 0.811
0.000 | 0.000
0.085 | 0.113
0.000 | 0.000
0.000 | 0.000
0.067 | 0.101
0.000 | 0.000
0.004 | 0.016
12peptides
spectra
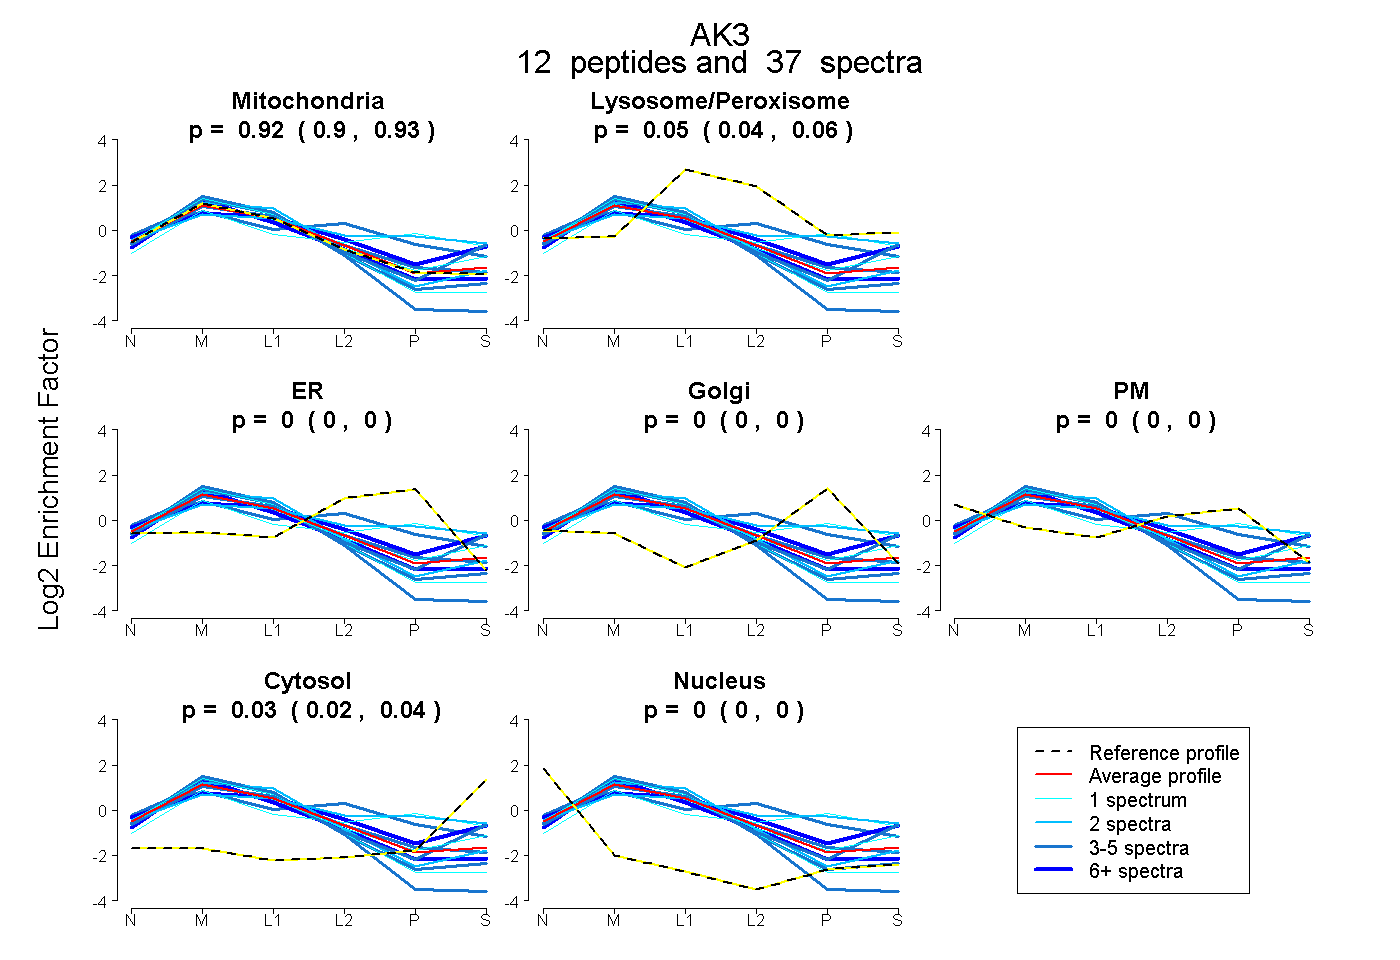
0.896 | 0.934
0.037 | 0.059
0.000 | 0.000
0.000 | 0.000
0.000 | 0.000
0.023 | 0.042
0.000 | 0.000
14peptides
spectra
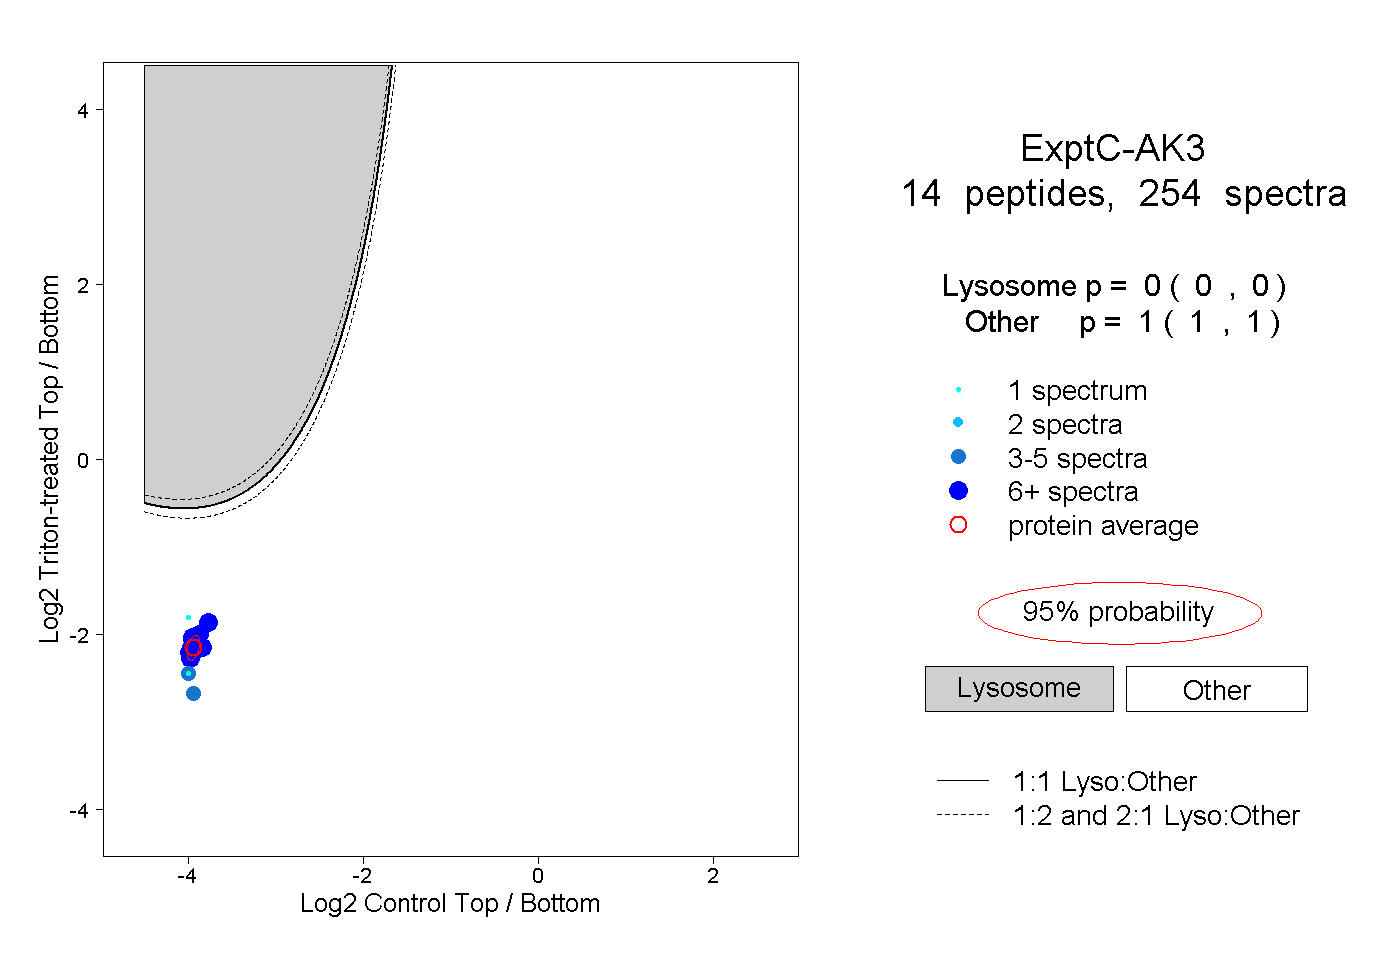
0.000 | 0.000
1.000 | 1.000
8peptides
spectra
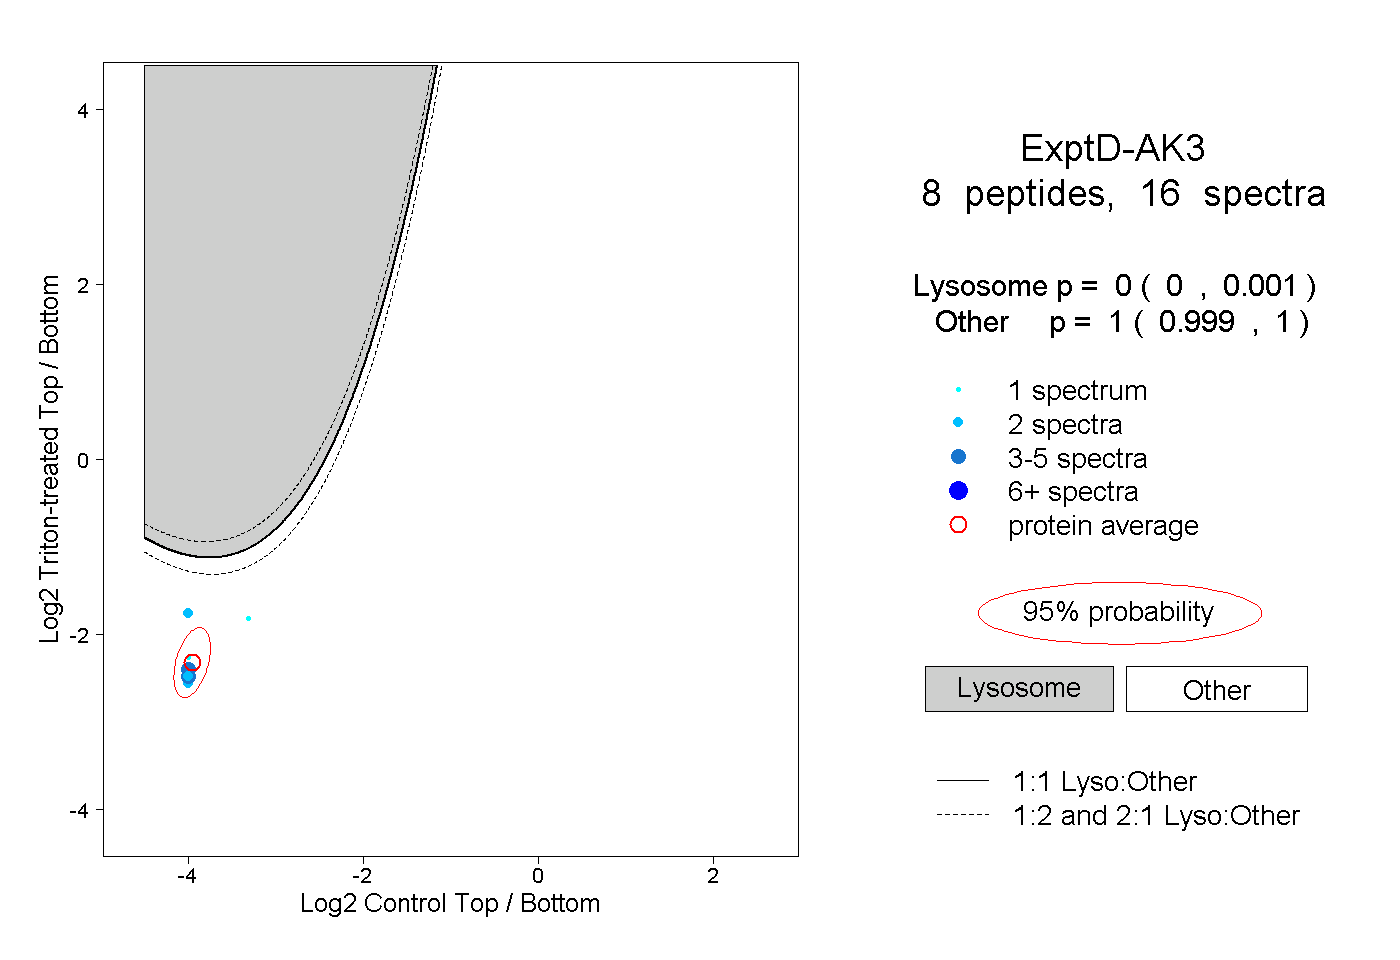
0.000 | 0.001
0.999 | 1.000