 15
15peptides
spectra
0.792 | 0.811
0.000 | 0.000
0.085 | 0.113
0.000 | 0.000
0.000 | 0.000
0.067 | 0.101
0.000 | 0.000
0.004 | 0.016
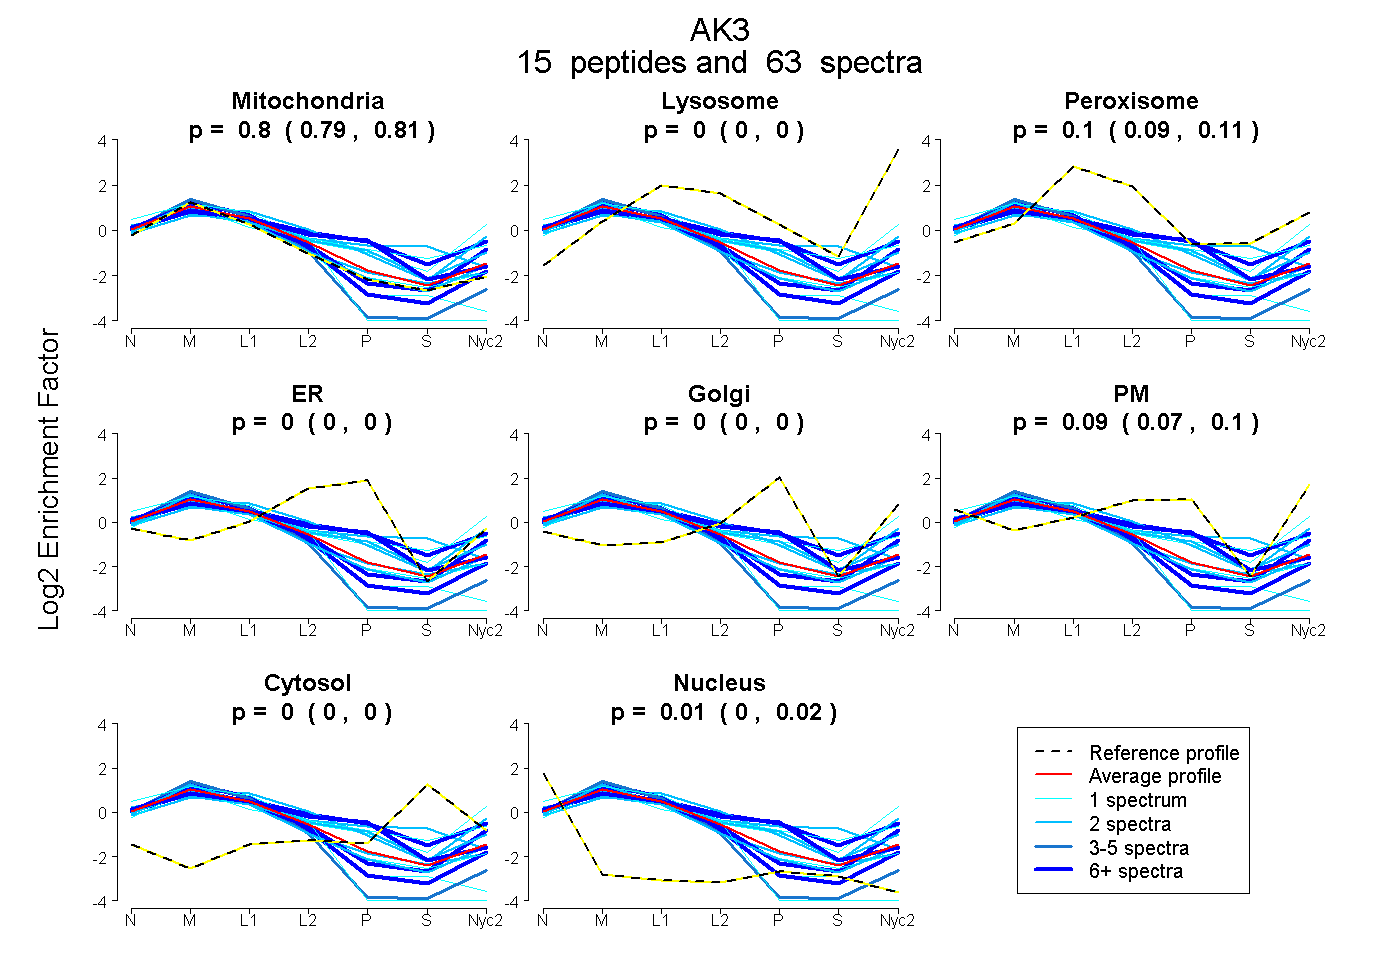
| Plot | Mito | Lyso | Perox | ER | Golgi | PM | Cytosol | Nucleus | |||||
| Expt A |
15 peptides |
63 spectra |
|
0.802 0.792 | 0.811 |
0.000 0.000 | 0.000 |
0.101 0.085 | 0.113 |
0.000 0.000 | 0.000 |
0.000 0.000 | 0.000 |
0.086 0.067 | 0.101 |
0.000 0.000 | 0.000 |
0.011 0.004 | 0.016 |
| 2 spectra, AVIMGAPGSGK | 0.742 | 0.000 | 0.129 | 0.000 | 0.000 | 0.020 | 0.000 | 0.110 | ||
| 1 spectrum, TVGIDDLTGEPLIQR | 0.942 | 0.000 | 0.039 | 0.000 | 0.000 | 0.011 | 0.000 | 0.008 | ||
| 3 spectra, QNMLQGTEIGVLAK | 0.982 | 0.000 | 0.000 | 0.000 | 0.000 | 0.000 | 0.000 | 0.018 | ||
| 11 spectra, LIPDDVMTR | 0.998 | 0.000 | 0.002 | 0.000 | 0.000 | 0.000 | 0.000 | 0.000 | ||
| 2 spectra, IWPHVYSFLQMK | 0.553 | 0.056 | 0.158 | 0.000 | 0.000 | 0.233 | 0.000 | 0.000 | ||
| 1 spectrum, GVLETFSGTETNK | 0.552 | 0.212 | 0.000 | 0.000 | 0.000 | 0.211 | 0.026 | 0.000 | ||
| 6 spectra, HLSSGDLLR | 0.460 | 0.000 | 0.234 | 0.000 | 0.131 | 0.137 | 0.038 | 0.000 | ||
| 16 spectra, WIHPASGR | 0.629 | 0.000 | 0.065 | 0.306 | 0.000 | 0.000 | 0.000 | 0.000 | ||
| 2 spectra, AYEAQTEPVLQYYQK | 0.501 | 0.000 | 0.203 | 0.099 | 0.000 | 0.000 | 0.197 | 0.000 | ||
| 1 spectrum, VYQIDTVINLNVPFEVIK | 0.921 | 0.000 | 0.000 | 0.000 | 0.000 | 0.000 | 0.000 | 0.079 | ||
| 1 spectrum, LALHELK | 0.928 | 0.000 | 0.000 | 0.000 | 0.000 | 0.000 | 0.000 | 0.072 | ||
| 2 spectra, VYNIEFNPPK | 0.931 | 0.025 | 0.000 | 0.000 | 0.000 | 0.044 | 0.000 | 0.000 | ||
| 1 spectrum, TFIDQGK | 0.541 | 0.079 | 0.109 | 0.000 | 0.075 | 0.078 | 0.117 | 0.000 | ||
| 2 spectra, VPETIQK | 0.647 | 0.000 | 0.115 | 0.000 | 0.147 | 0.091 | 0.000 | 0.000 | ||
| 12 spectra, TLPQAEALDR | 0.815 | 0.147 | 0.000 | 0.000 | 0.000 | 0.008 | 0.000 | 0.030 |
| Plot | Mito | Lyso or Perox | ER | Golgi | PM | Cytosol | Nucleus | ||||||
| Expt B |
12 peptides |
37 spectra |
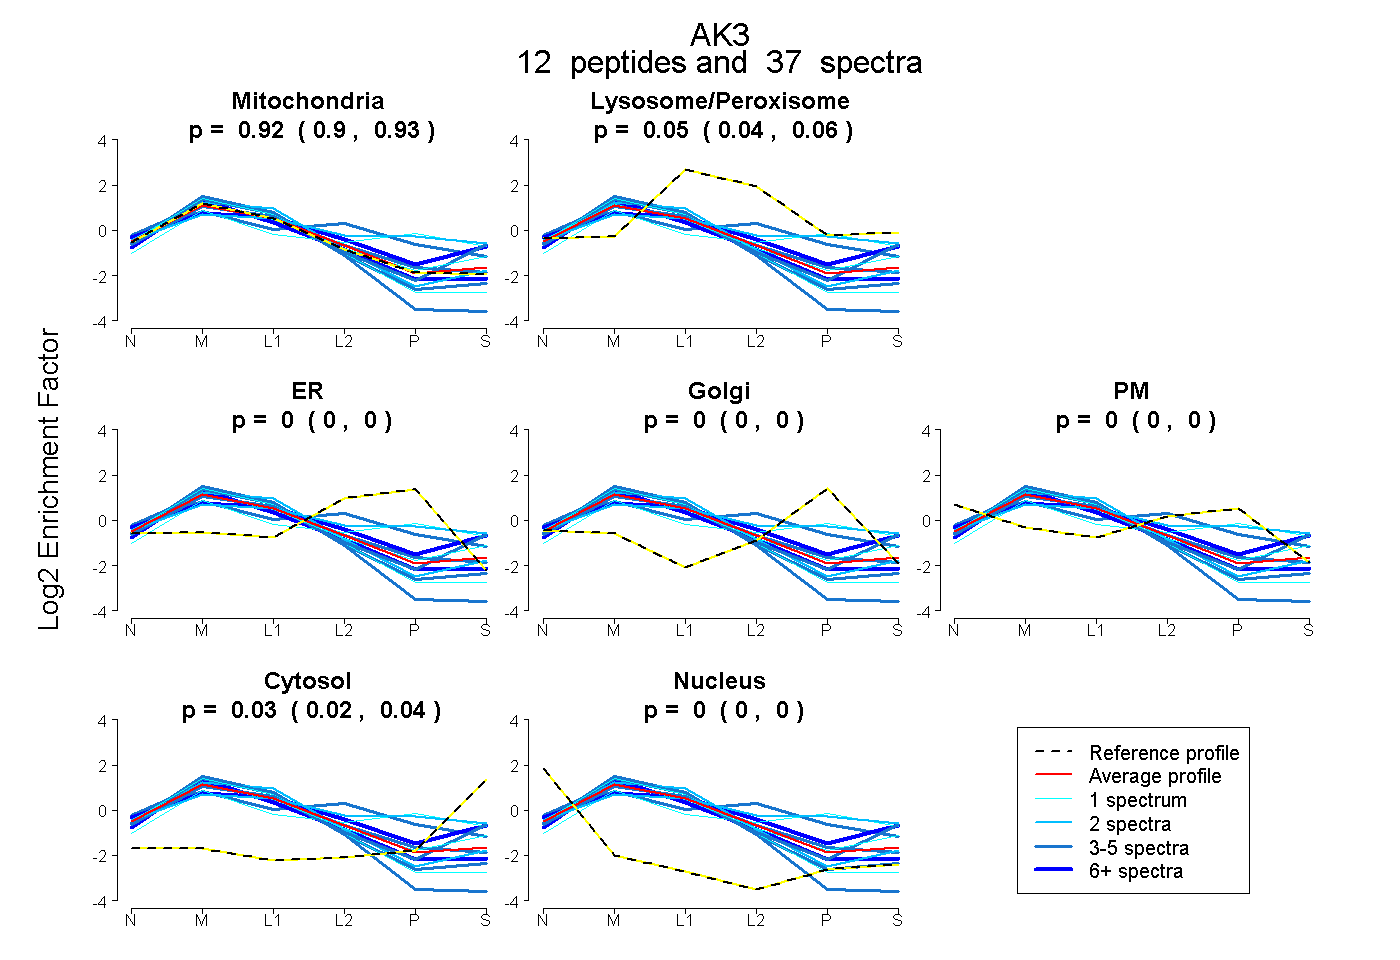 |
0.917 0.896 | 0.934 |
0.049 0.037 | 0.059 |
0.000 0.000 | 0.000 |
0.000 0.000 | 0.000 |
0.000 0.000 | 0.000 |
0.034 0.023 | 0.042 |
0.000 0.000 | 0.000 |
|||
| Plot | Lyso | Other | |||||||||||
| Expt C |
14 peptides |
254 spectra |
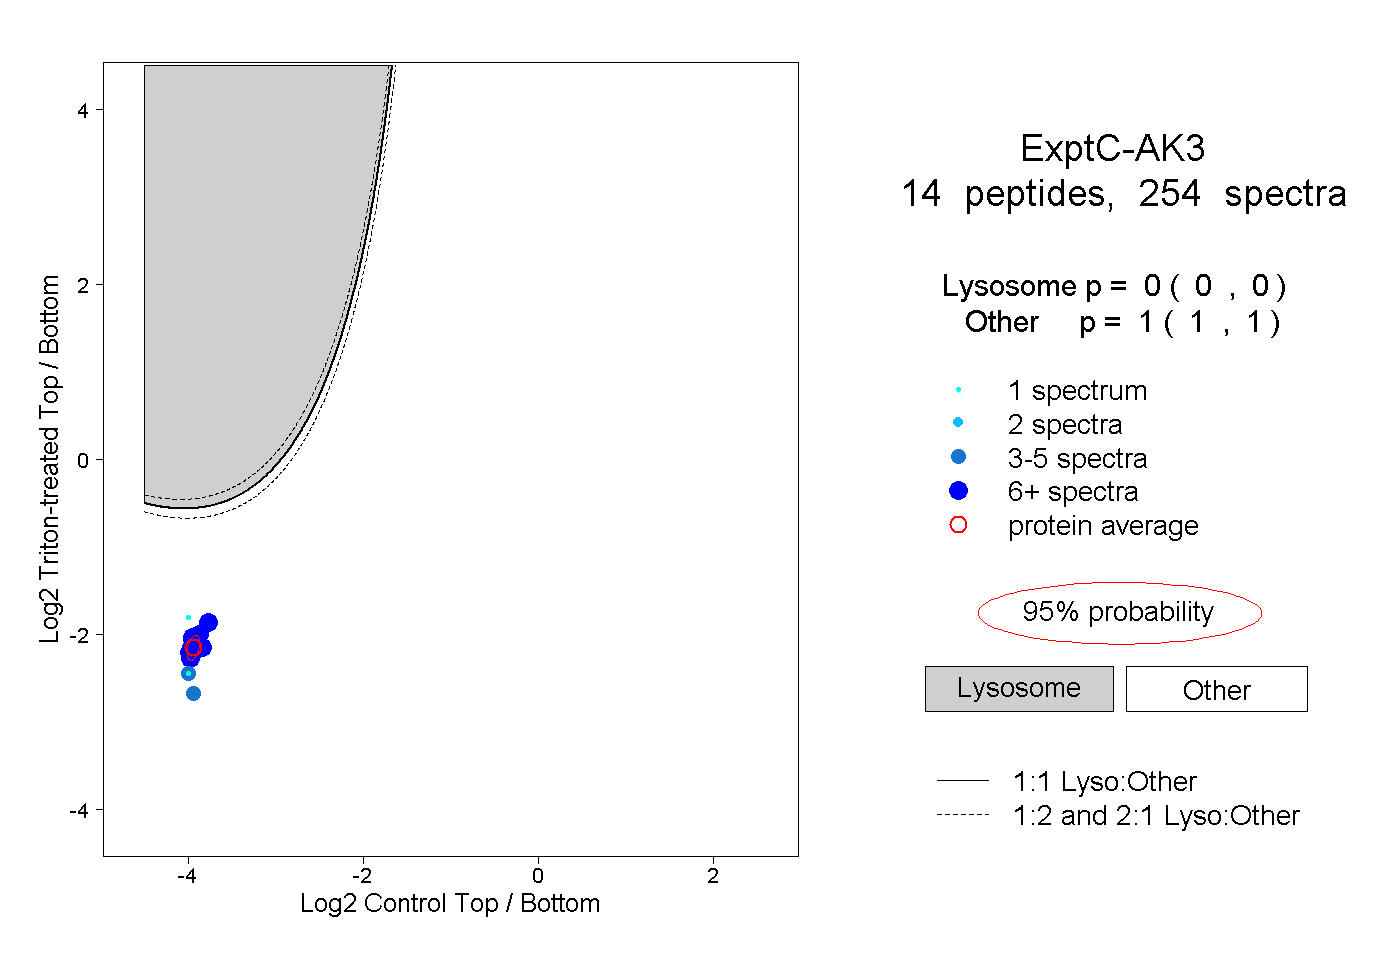 |
0.000 0.000 | 0.000 |
1.000 1.000 | 1.000 |
||||||||
| Plot | Lyso | Other | |||||||||||
| Expt D |
8 peptides |
16 spectra |
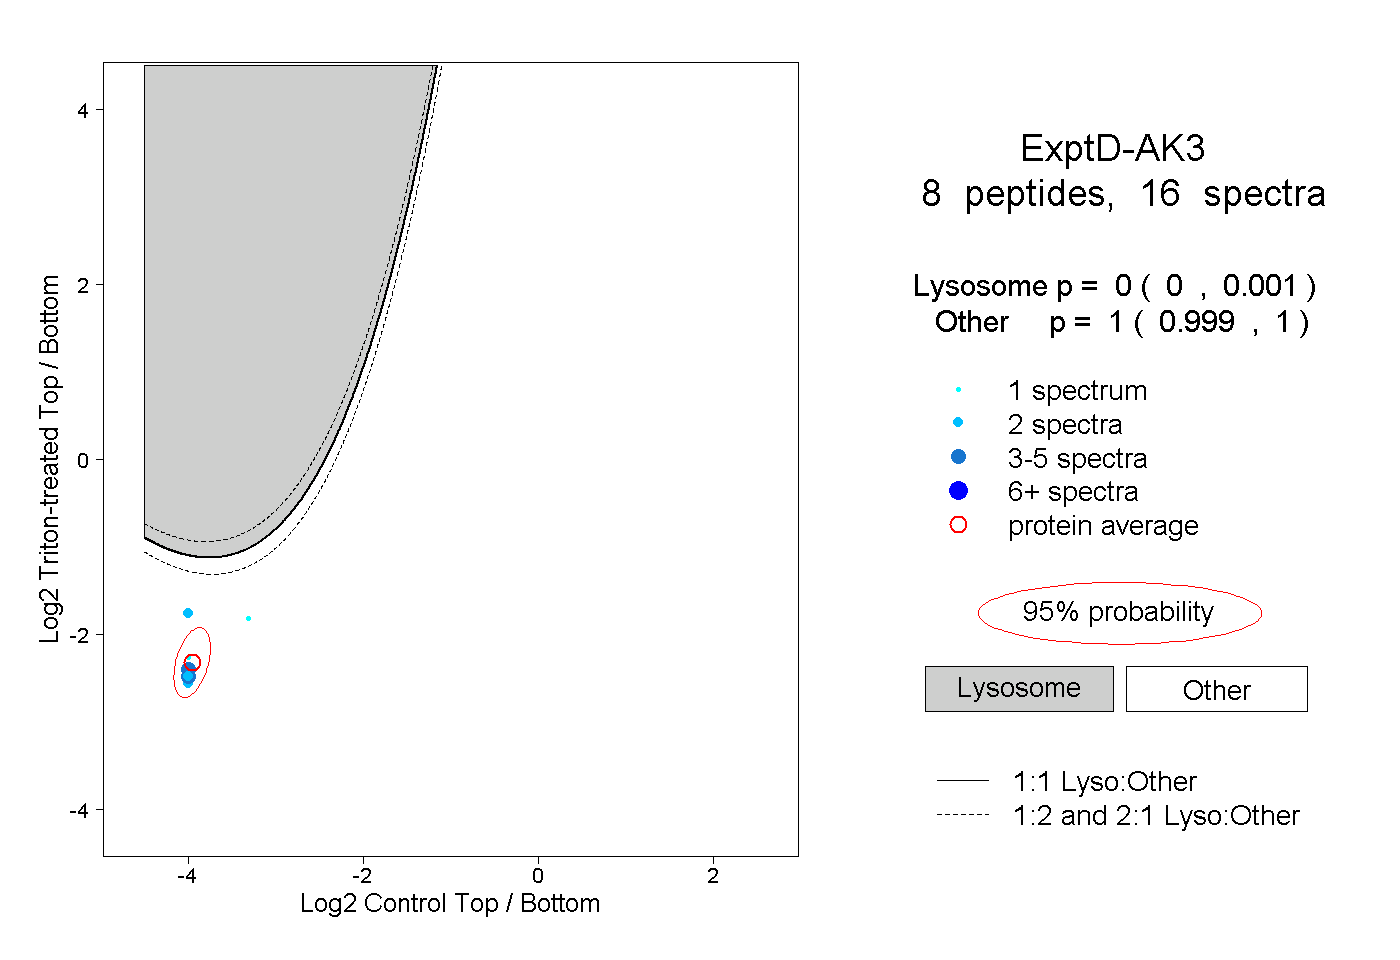 |
0.000 0.000 | 0.001 |
1.000 0.999 | 1.000 |