 8
8peptides
spectra
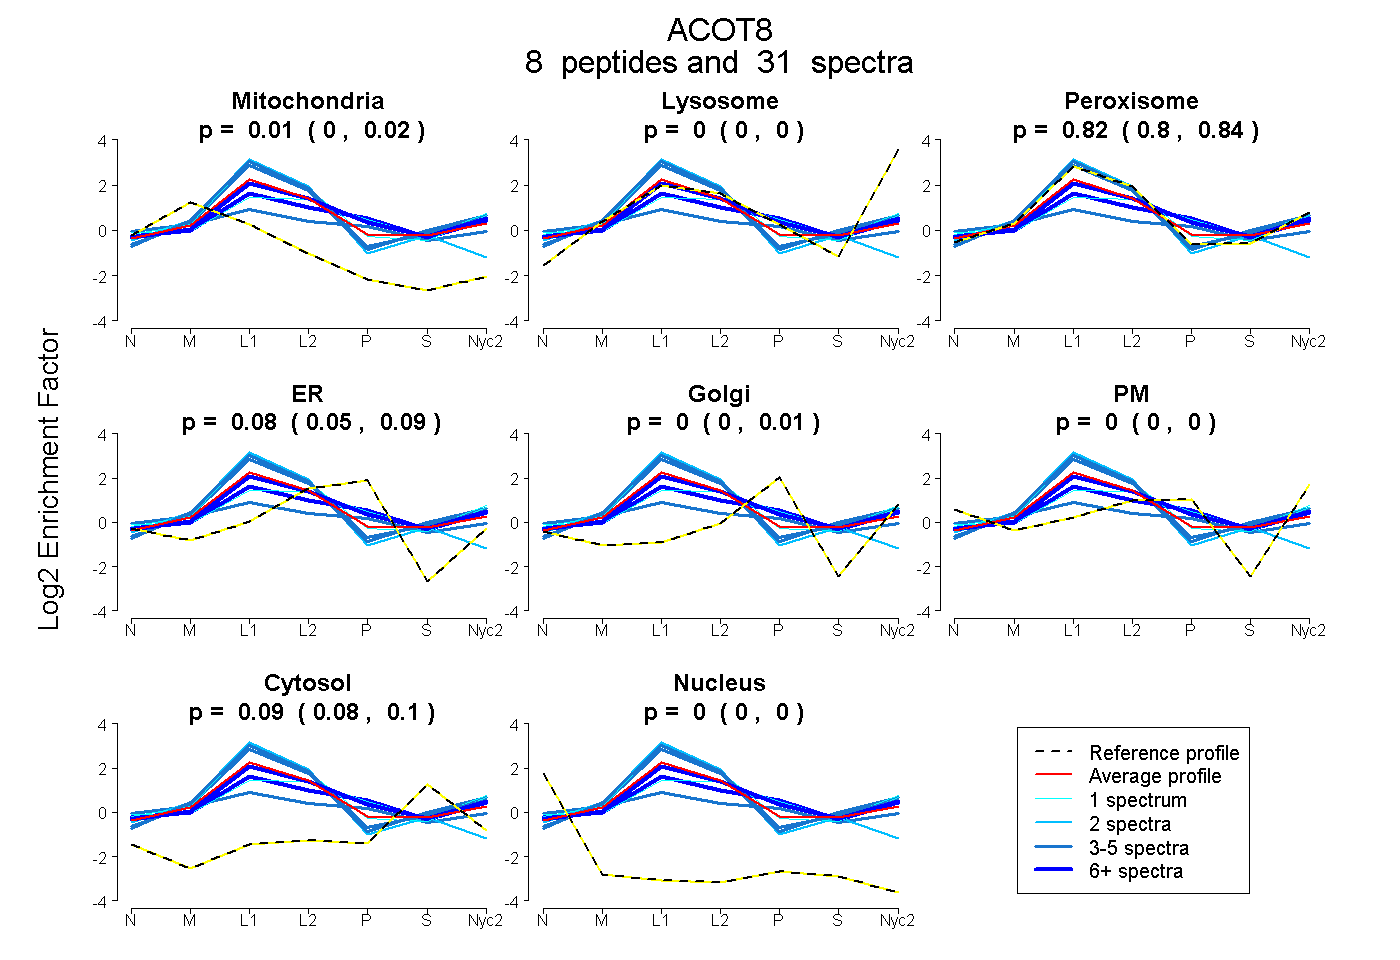
0.000 | 0.020
0.000 | 0.000
0.798 | 0.838
0.054 | 0.093
0.000 | 0.008
0.000 | 0.000
0.083 | 0.100
0.000 | 0.000
4peptides
spectra
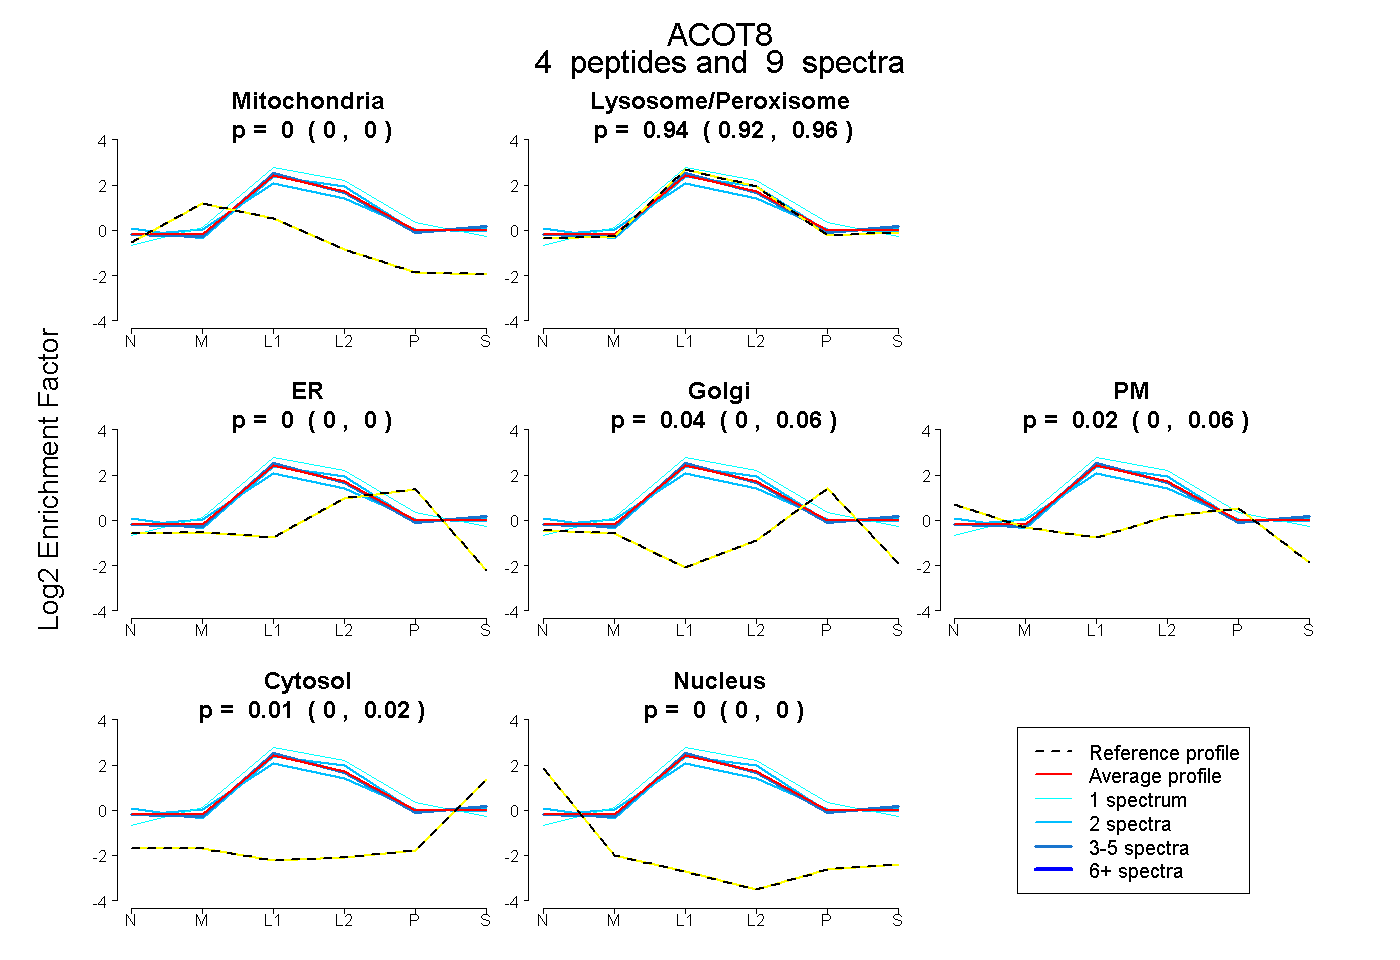
0.000 | 0.000
0.916 | 0.956
0.000 | 0.000
0.000 | 0.058
0.000 | 0.062
0.000 | 0.017
0.000 | 0.000
13peptides
spectra
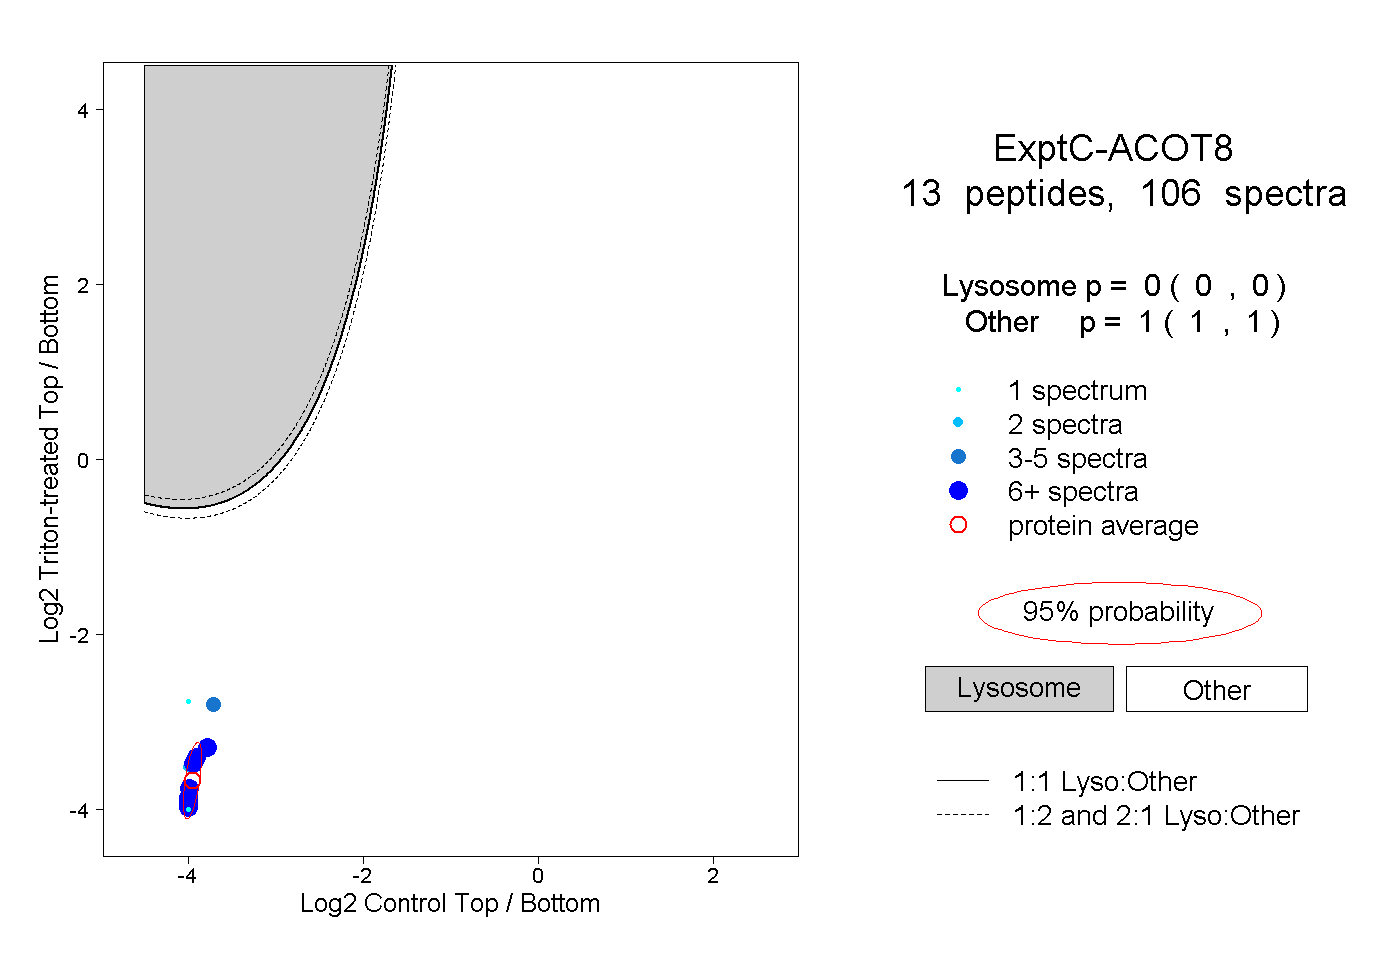
0.000 | 0.000
1.000 | 1.000
7peptides
spectra
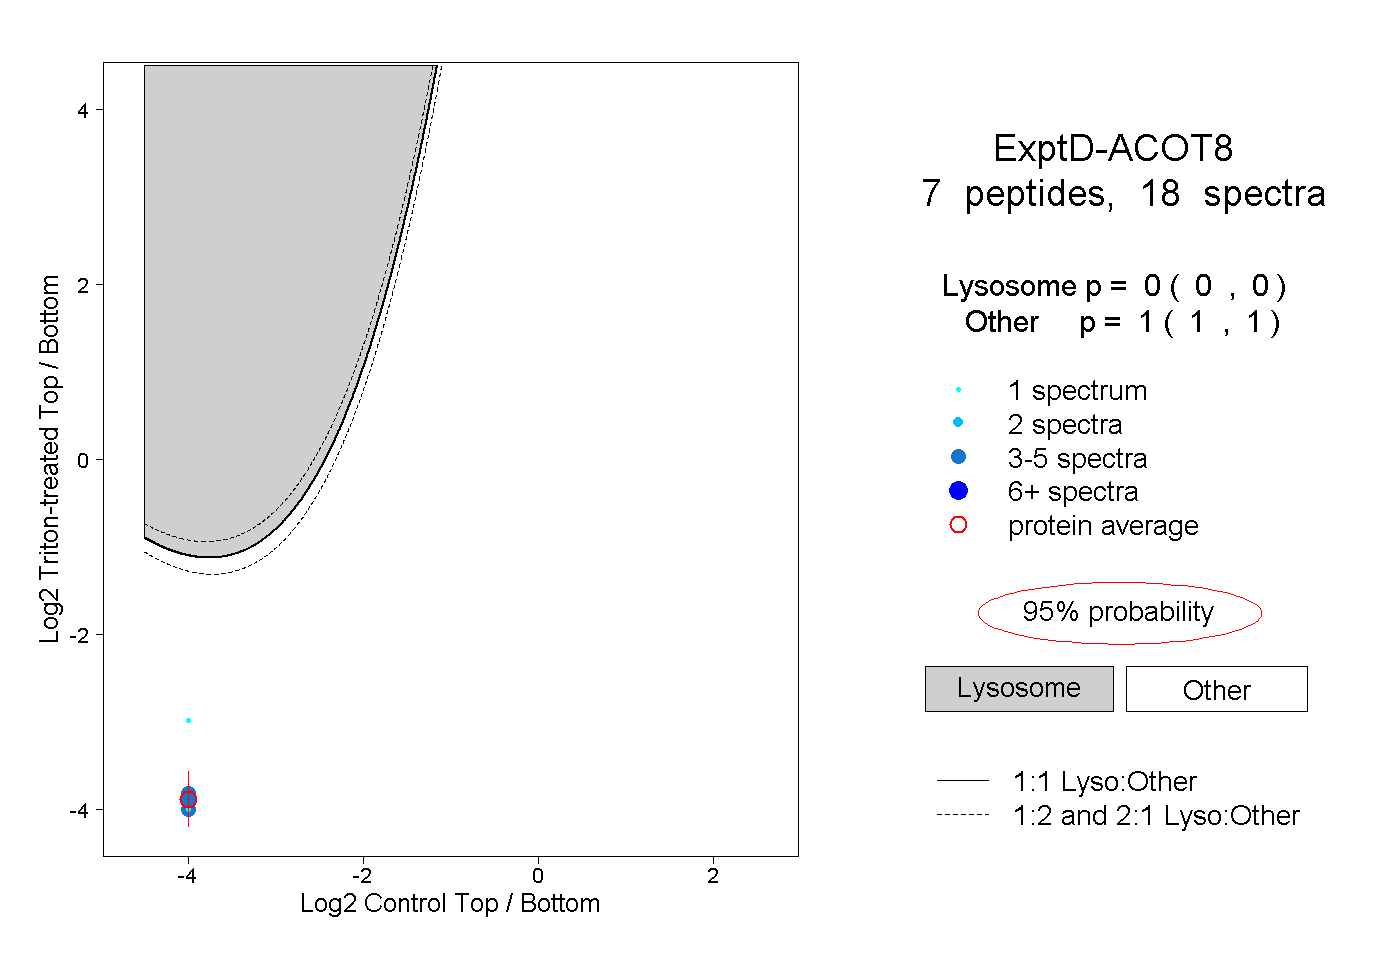
0.000 | 0.000
1.000 | 1.000