 1
1peptide
spectrum
NA | NA
NA | NA
NA | NA
NA | NA
NA | NA
NA | NA
NA | NA
NA | NA
2peptides
spectra
0.002 | 0.061
0.938 | 0.998
| Plot | Mito | Lyso | Perox | ER | Golgi | PM | Cytosol | Nucleus | |||||
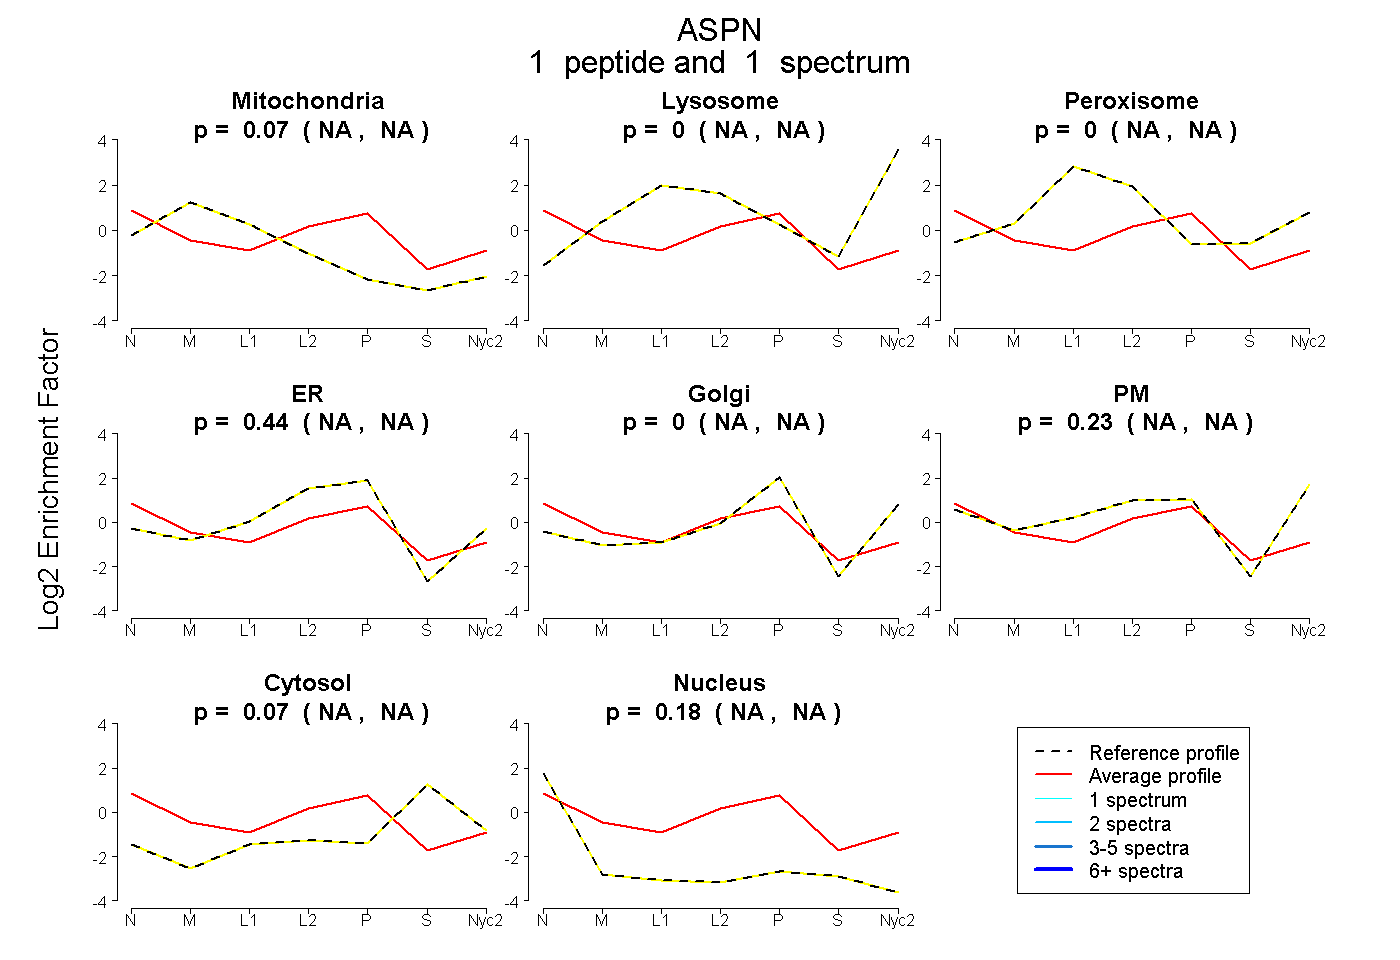
| Expt A |
1 peptide |
1 spectrum |
|
0.074 NA | NA |
0.000 NA | NA |
0.000 NA | NA |
0.439 NA | NA |
0.000 NA | NA |
0.230 NA | NA |
0.072 NA | NA |
0.185 NA | NA |
||
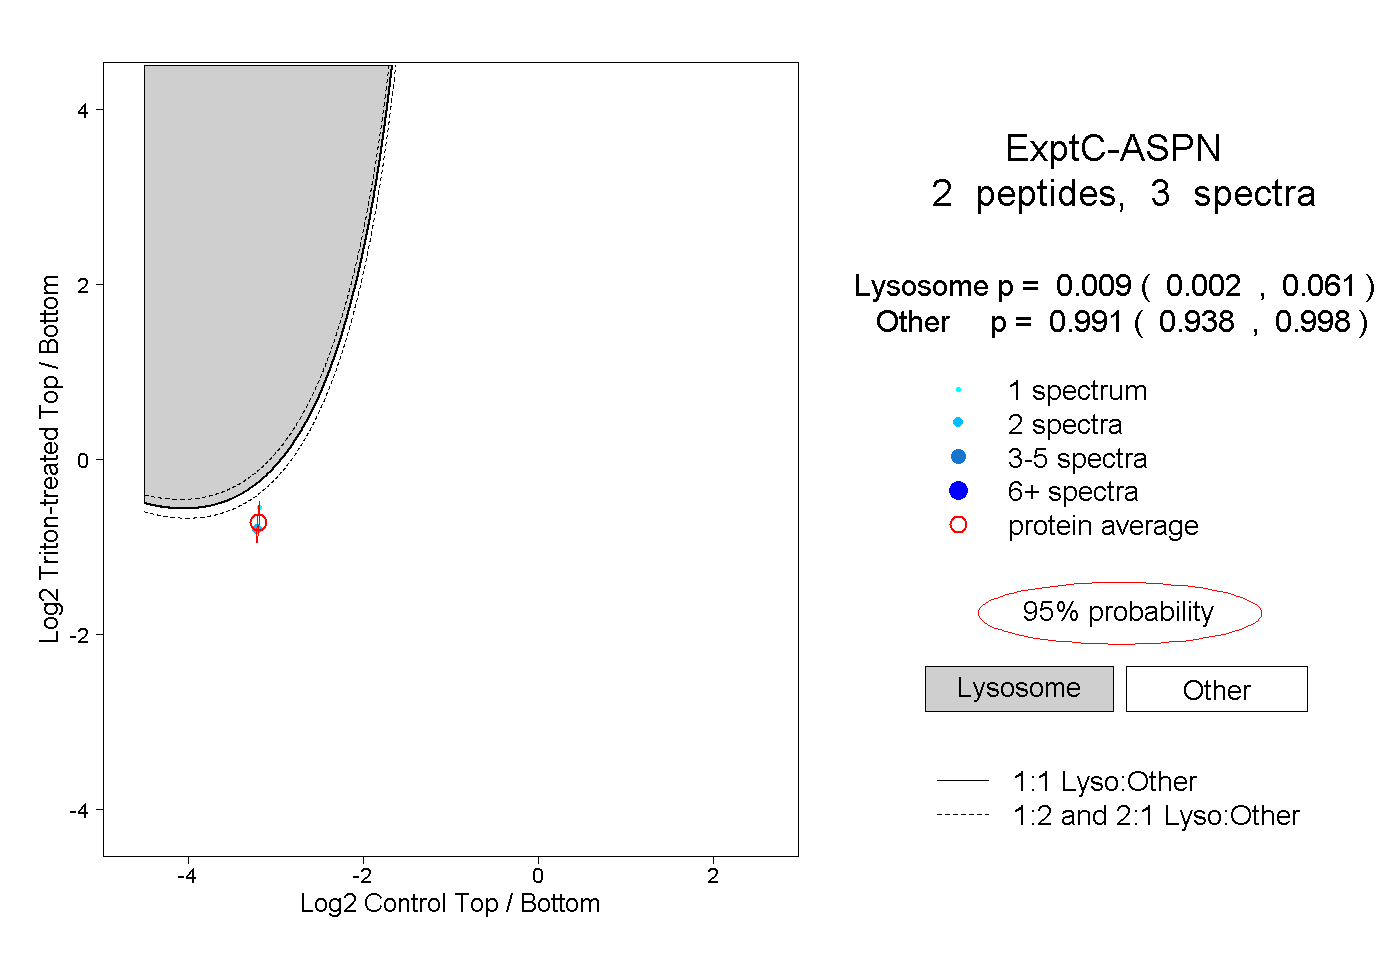
| Plot | Lyso | Other | |||||||||||
| Expt C |
2 peptides |
3 spectra |
|
0.009 0.002 | 0.061 |
0.991 0.938 | 0.998 |