 10
10peptides
spectra
0.000 | 0.000
0.067 | 0.109
0.000 | 0.054
0.000 | 0.055
0.014 | 0.099
0.182 | 0.254
0.566 | 0.595
0.000 | 0.000
| Plot | Mito | Lyso | Perox | ER | Golgi | PM | Cytosol | Nucleus | |||||
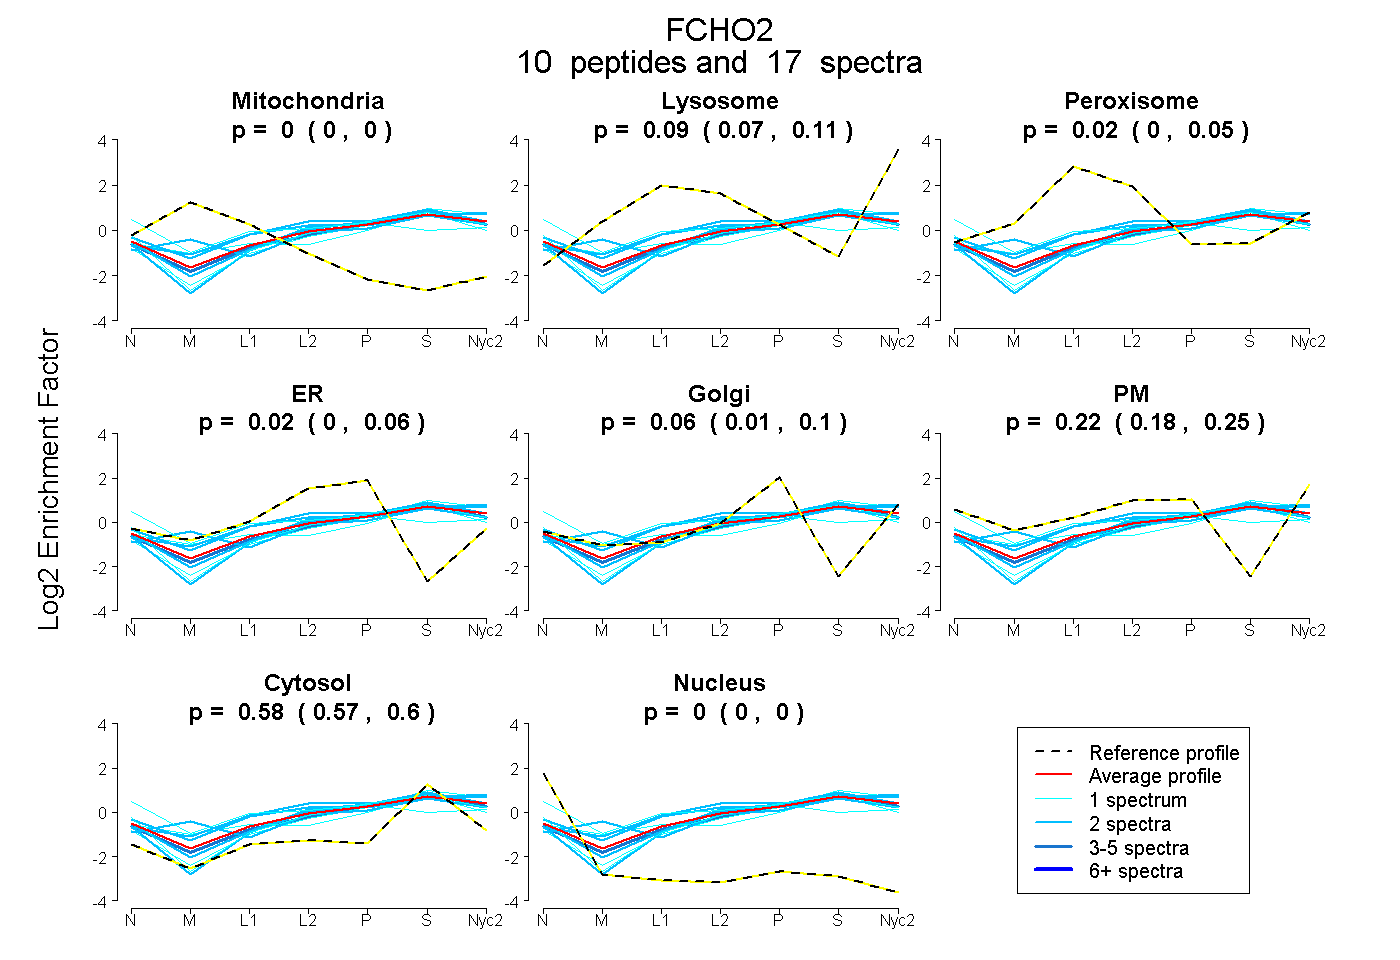
| Expt A |
10 peptides |
17 spectra |
|
0.000 0.000 | 0.000 |
0.090 0.067 | 0.109 |
0.023 0.000 | 0.054 |
0.022 0.000 | 0.055 |
0.060 0.014 | 0.099 |
0.223 0.182 | 0.254 |
0.582 0.566 | 0.595 |
0.000 0.000 | 0.000 |
| 1 spectrum, ERPGLIEFEECDPASAVEGIKPR | 0.000 | 0.008 | 0.172 | 0.000 | 0.165 | 0.072 | 0.582 | 0.000 | ||
| 2 spectra, ATIEEAYSR | 0.000 | 0.087 | 0.000 | 0.072 | 0.047 | 0.185 | 0.608 | 0.000 | ||
| 2 spectra, SDSGGSGSLR | 0.018 | 0.158 | 0.046 | 0.000 | 0.213 | 0.028 | 0.538 | 0.000 | ||
| 2 spectra, ELADFVR | 0.000 | 0.079 | 0.000 | 0.062 | 0.137 | 0.070 | 0.653 | 0.000 | ||
| 1 spectrum, VFTSNPSPAVLCFR | 0.000 | 0.000 | 0.149 | 0.029 | 0.000 | 0.411 | 0.395 | 0.015 | ||
| 3 spectra, ADFEQK | 0.000 | 0.085 | 0.039 | 0.000 | 0.185 | 0.081 | 0.610 | 0.000 | ||
| 1 spectrum, YGEEQVK | 0.000 | 0.000 | 0.000 | 0.022 | 0.100 | 0.235 | 0.643 | 0.000 | ||
| 2 spectra, HSPVQMNR | 0.000 | 0.121 | 0.100 | 0.000 | 0.000 | 0.281 | 0.497 | 0.000 | ||
| 2 spectra, MTETAQK | 0.000 | 0.241 | 0.088 | 0.054 | 0.086 | 0.065 | 0.466 | 0.000 | ||
| 1 spectrum, EIIGSLSNAIK | 0.000 | 0.150 | 0.000 | 0.000 | 0.199 | 0.000 | 0.651 | 0.000 |
| Plot | Mito | Lyso or Perox | ER | Golgi | PM | Cytosol | Nucleus | ||||||
| Expt B |
2 peptides |
3 spectra |
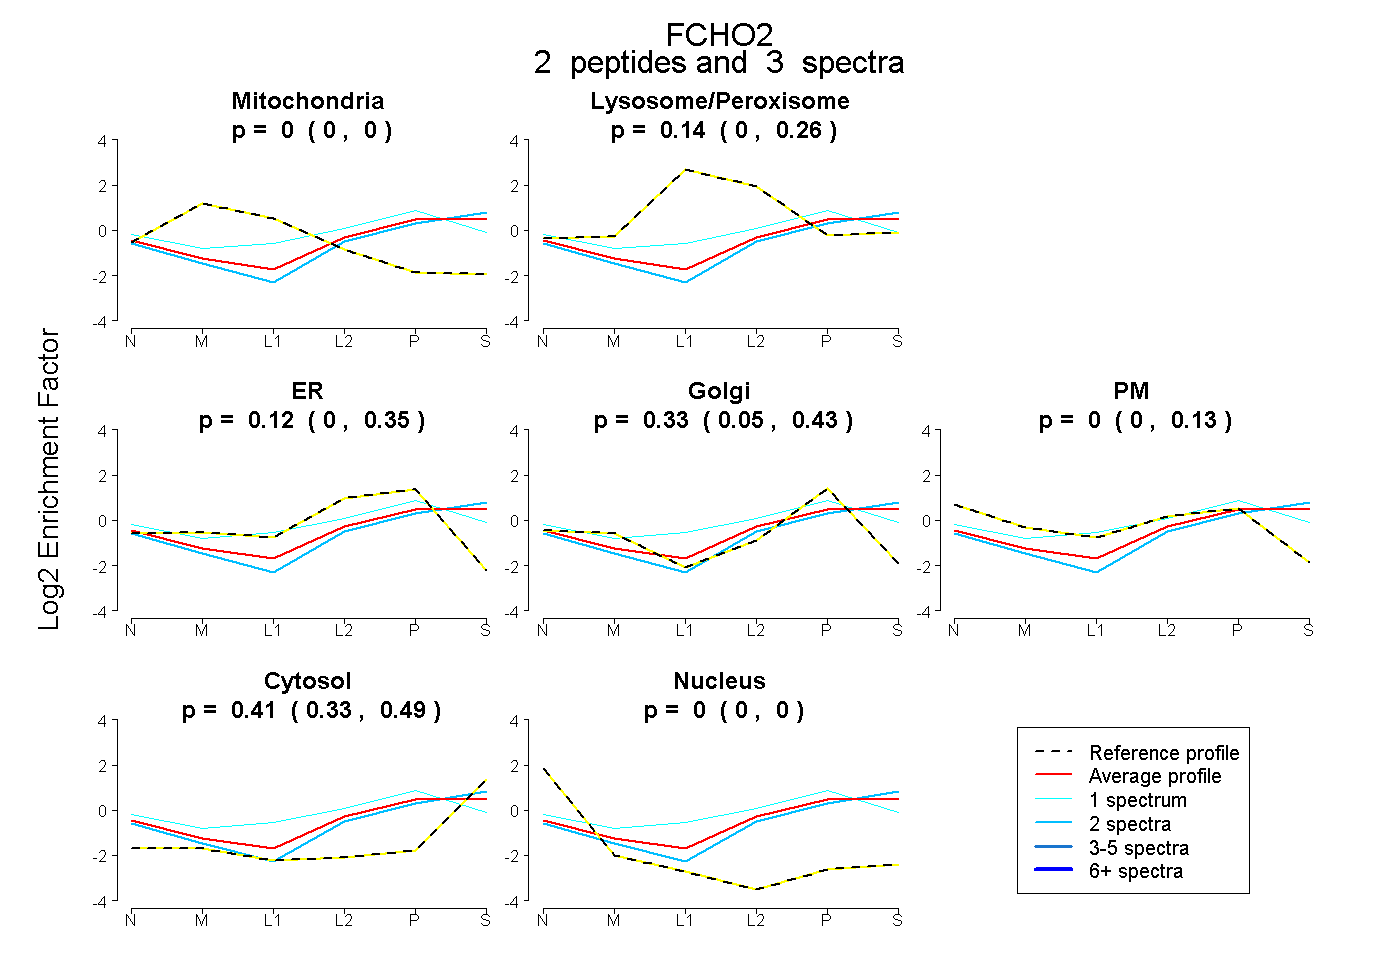 |
0.000 0.000 | 0.000 |
0.138 0.000 | 0.262 |
0.122 0.000 | 0.345 |
0.330 0.051 | 0.432 |
0.000 0.000 | 0.127 |
0.411 0.329 | 0.494 |
0.000 0.000 | 0.000 |
|||
| Plot | Lyso | Other | |||||||||||
| Expt C |
15 peptides |
45 spectra |
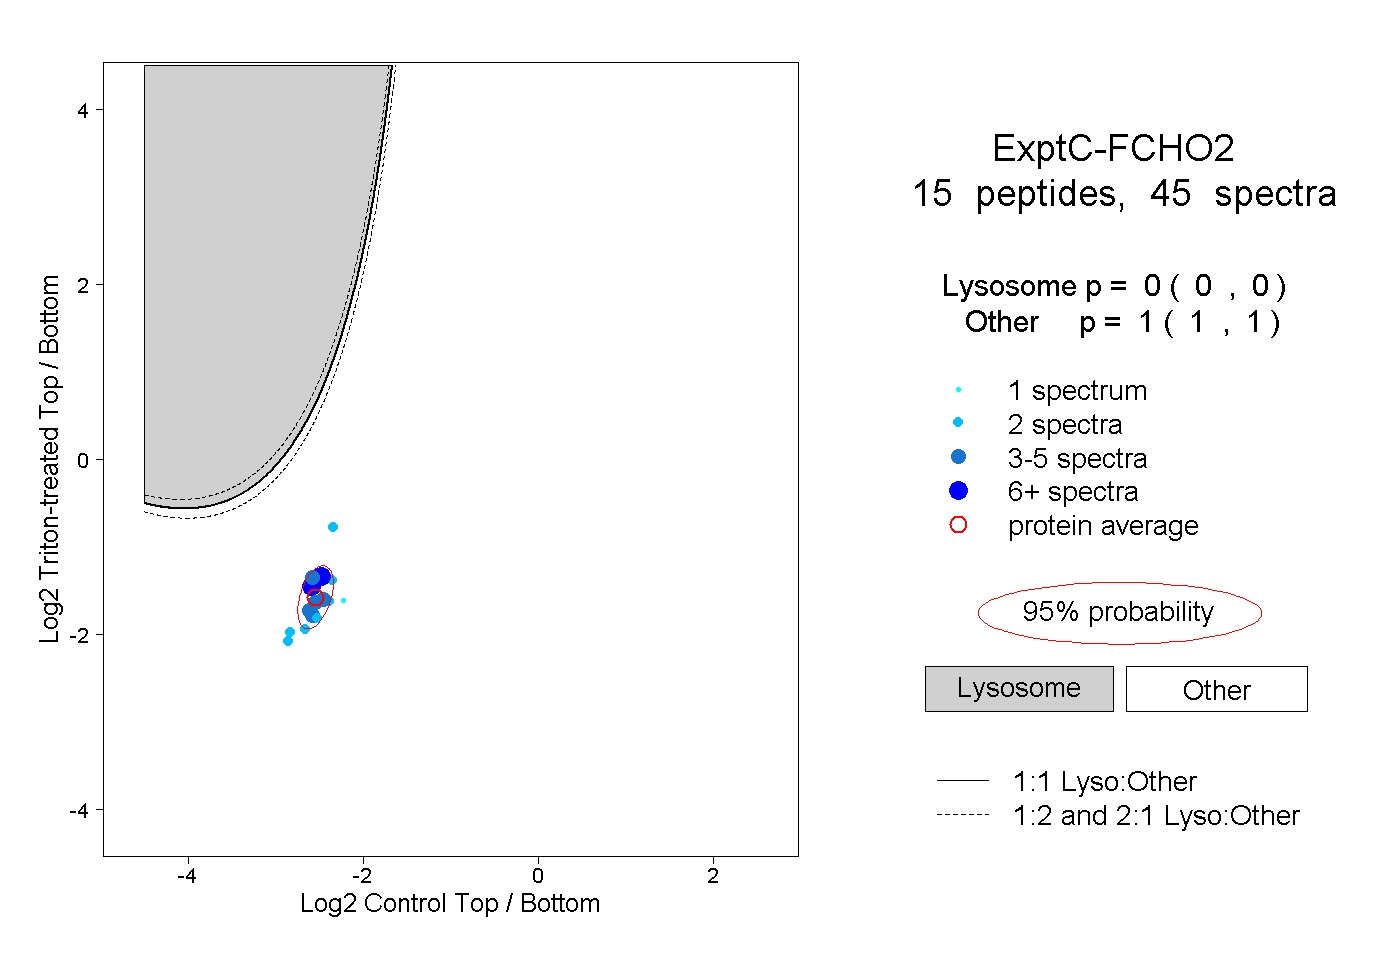 |
0.000 0.000 | 0.000 |
1.000 1.000 | 1.000 |
||||||||
| Plot | Lyso | Other | |||||||||||
| Expt D |
3 peptides |
4 spectra |
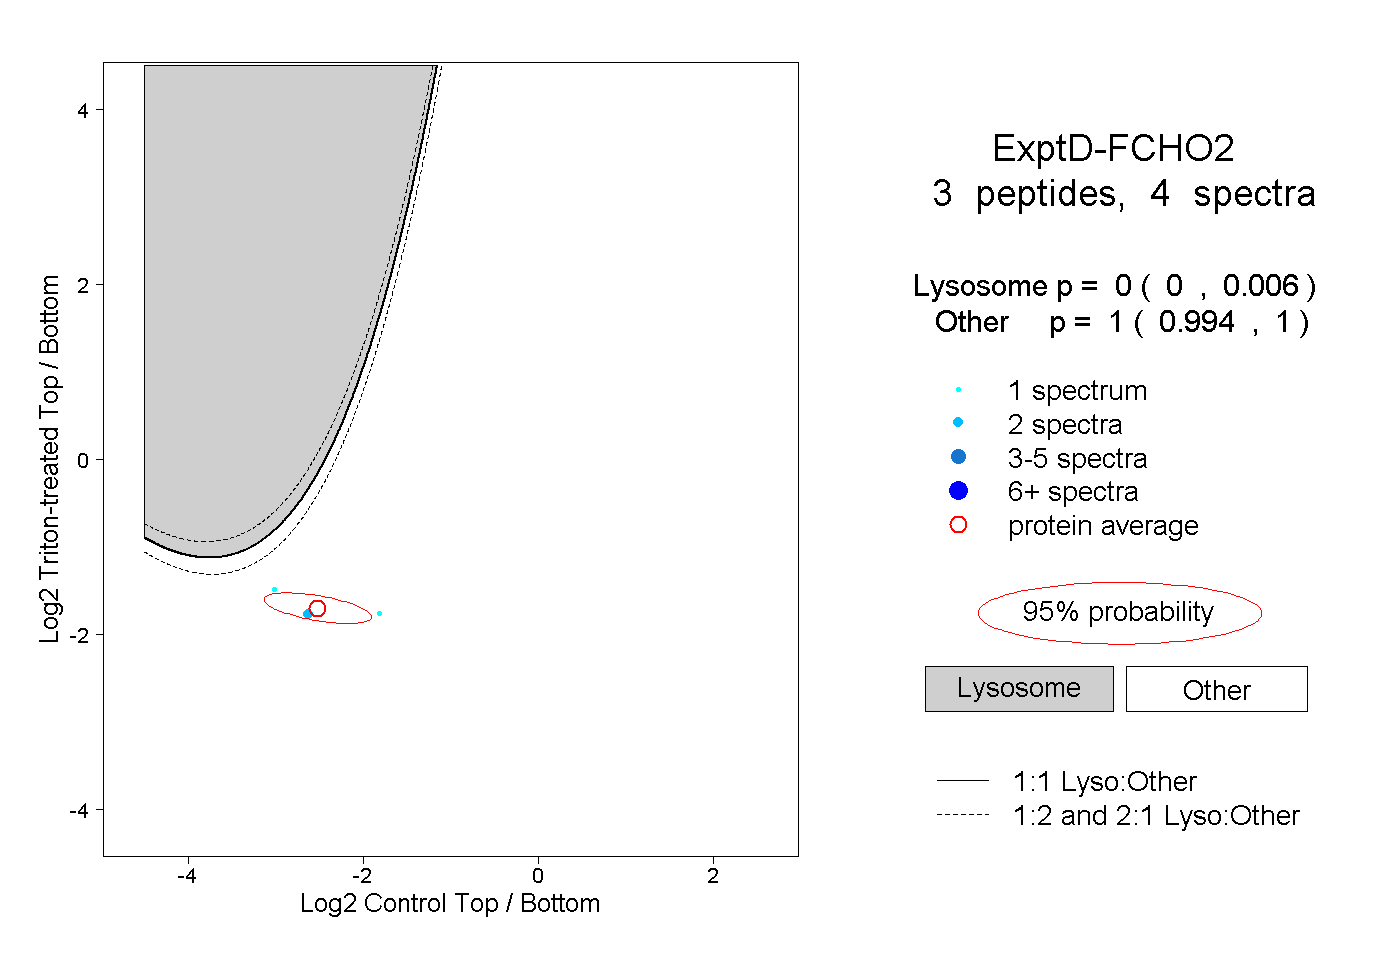 |
0.000 0.000 | 0.006 |
1.000 0.994 | 1.000 |