12
12peptides
spectra

0.052 | 0.080
0.000 | 0.000
0.214 | 0.260
0.356 | 0.398
0.221 | 0.273
0.000 | 0.047
0.000 | 0.000
0.032 | 0.047
7peptides
spectra
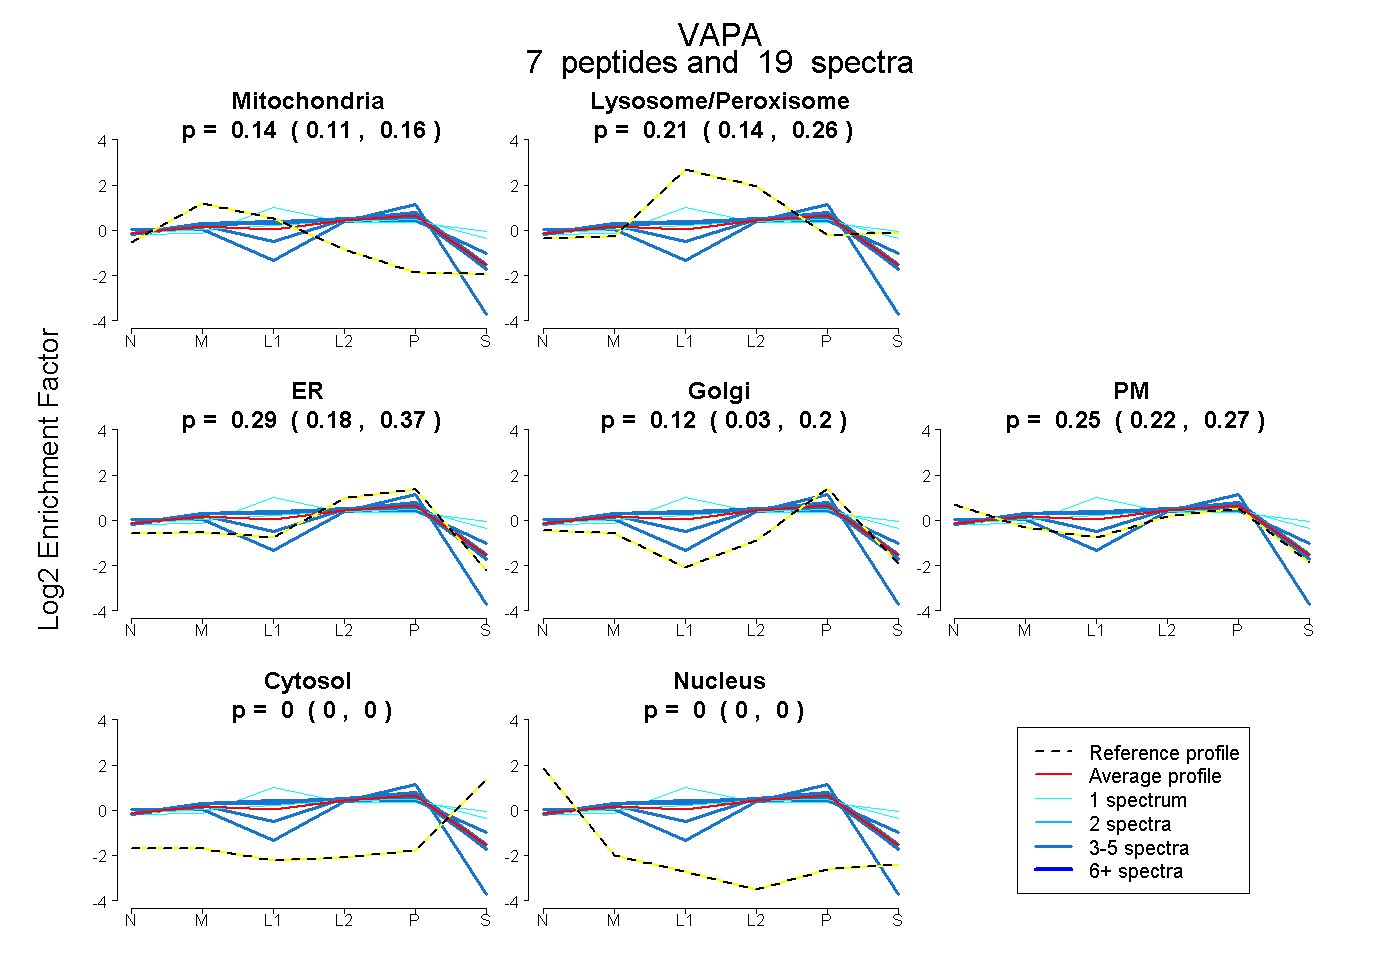
0.105 | 0.164
0.142 | 0.260
0.180 | 0.374
0.027 | 0.199
0.221 | 0.269
0.000 | 0.000
0.000 | 0.000