 6
6peptides
spectra
0.000 | 0.000
0.069 | 0.137
0.000 | 0.031
0.000 | 0.000
0.000 | 0.000
0.851 | 0.920
0.000 | 0.000
0.000 | 0.000
| Plot | Mito | Lyso | Perox | ER | Golgi | PM | Cytosol | Nucleus | |||||
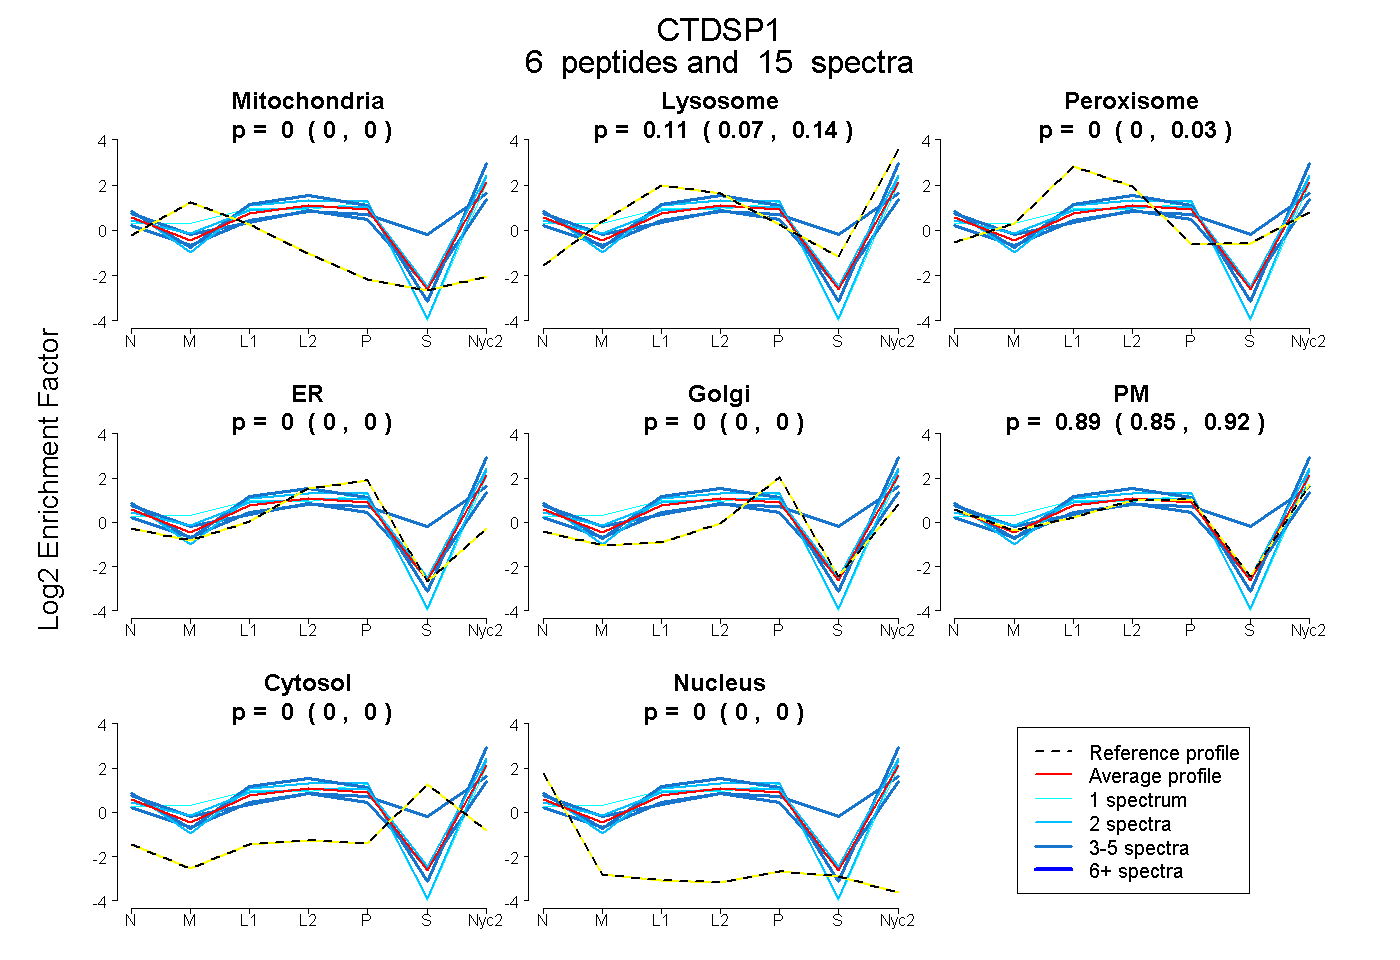
| Expt A |
6 peptides |
15 spectra |
|
0.000 0.000 | 0.000 |
0.110 0.069 | 0.137 |
0.000 0.000 | 0.031 |
0.000 0.000 | 0.000 |
0.000 0.000 | 0.000 |
0.890 0.851 | 0.920 |
0.000 0.000 | 0.000 |
0.000 0.000 | 0.000 |
| 4 spectra, RPHVDEFLQR | 0.093 | 0.000 | 0.037 | 0.000 | 0.000 | 0.862 | 0.000 | 0.008 | ||
| 1 spectrum, HTPVQYLLPEVK | 0.000 | 0.069 | 0.000 | 0.000 | 0.000 | 0.931 | 0.000 | 0.000 | ||
| 3 spectra, VDDVYSVLR | 0.000 | 0.173 | 0.000 | 0.000 | 0.000 | 0.827 | 0.000 | 0.000 | ||
| 3 spectra, ESCVFHR | 0.000 | 0.189 | 0.114 | 0.000 | 0.000 | 0.464 | 0.233 | 0.000 | ||
| 2 spectra, SAVSQKPR | 0.000 | 0.000 | 0.000 | 0.000 | 0.000 | 1.000 | 0.000 | 0.000 | ||
| 2 spectra, YADPVADLLDK | 0.000 | 0.215 | 0.000 | 0.000 | 0.000 | 0.785 | 0.000 | 0.000 |
| Plot | Mito | Lyso or Perox | ER | Golgi | PM | Cytosol | Nucleus | ||||||
| Expt B |
4 peptides |
7 spectra |
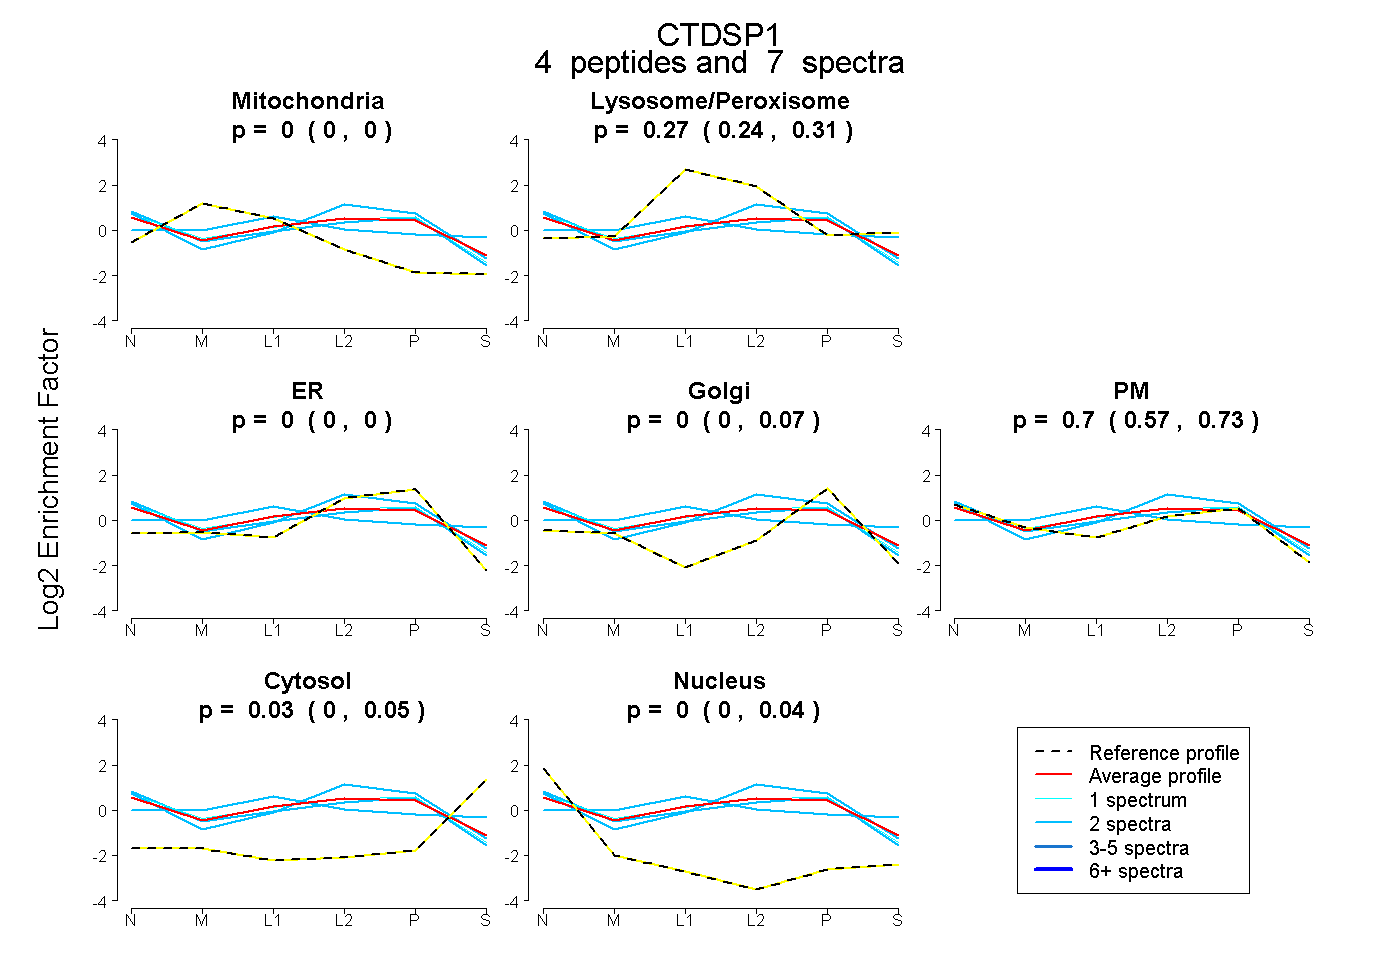 |
0.000 0.000 | 0.000 |
0.270 0.244 | 0.313 |
0.000 0.000 | 0.000 |
0.000 0.000 | 0.069 |
0.705 0.572 | 0.731 |
0.026 0.000 | 0.050 |
0.000 0.000 | 0.037 |
|||
| Plot | Lyso | Other | |||||||||||
| Expt C |
6 peptides |
22 spectra |
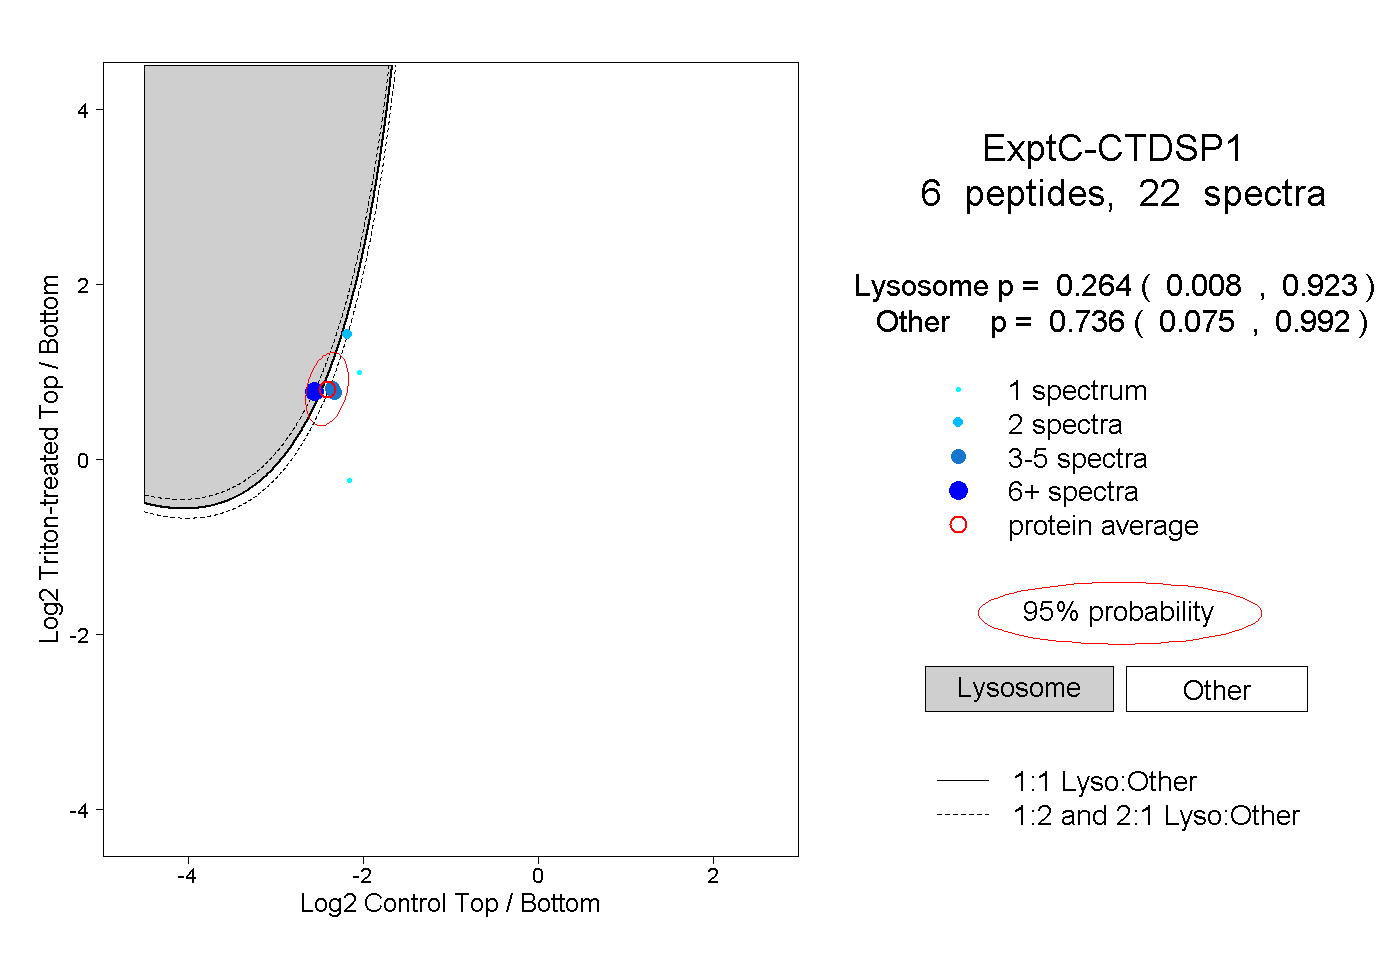 |
0.264 0.008 | 0.923 |
0.736 0.075 | 0.992 |
||||||||
| Plot | Lyso | Other | |||||||||||
| Expt D |
1 peptide |
2 spectra |
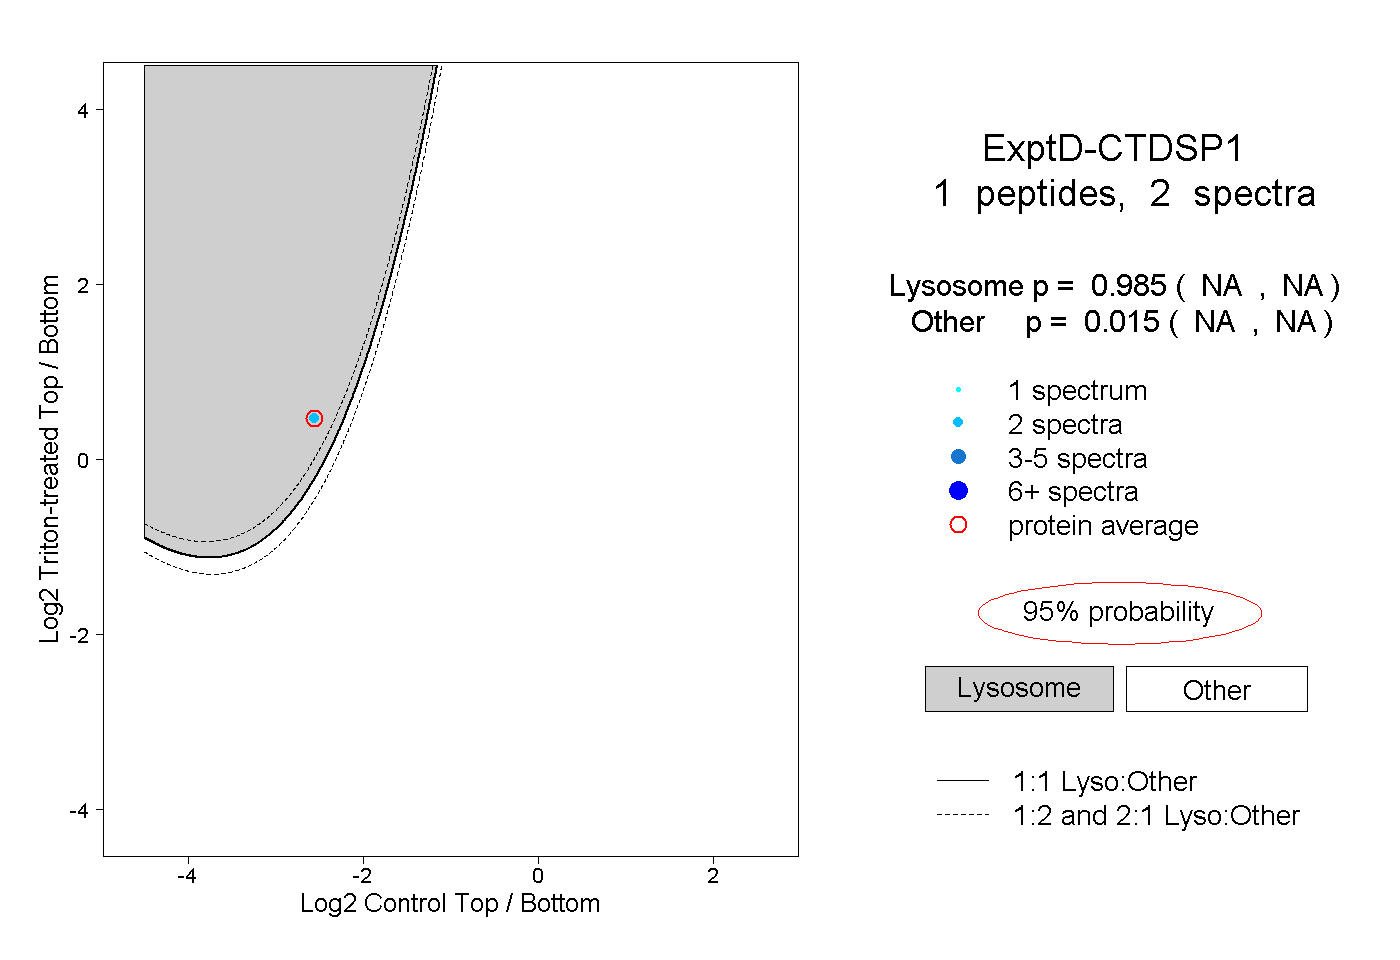 |
0.985 NA | NA |
0.015 NA | NA |