 10
10peptides
spectra
0.000 | 0.000
0.174 | 0.198
0.000 | 0.000
0.000 | 0.000
0.080 | 0.128
0.032 | 0.091
0.635 | 0.650
0.000 | 0.000
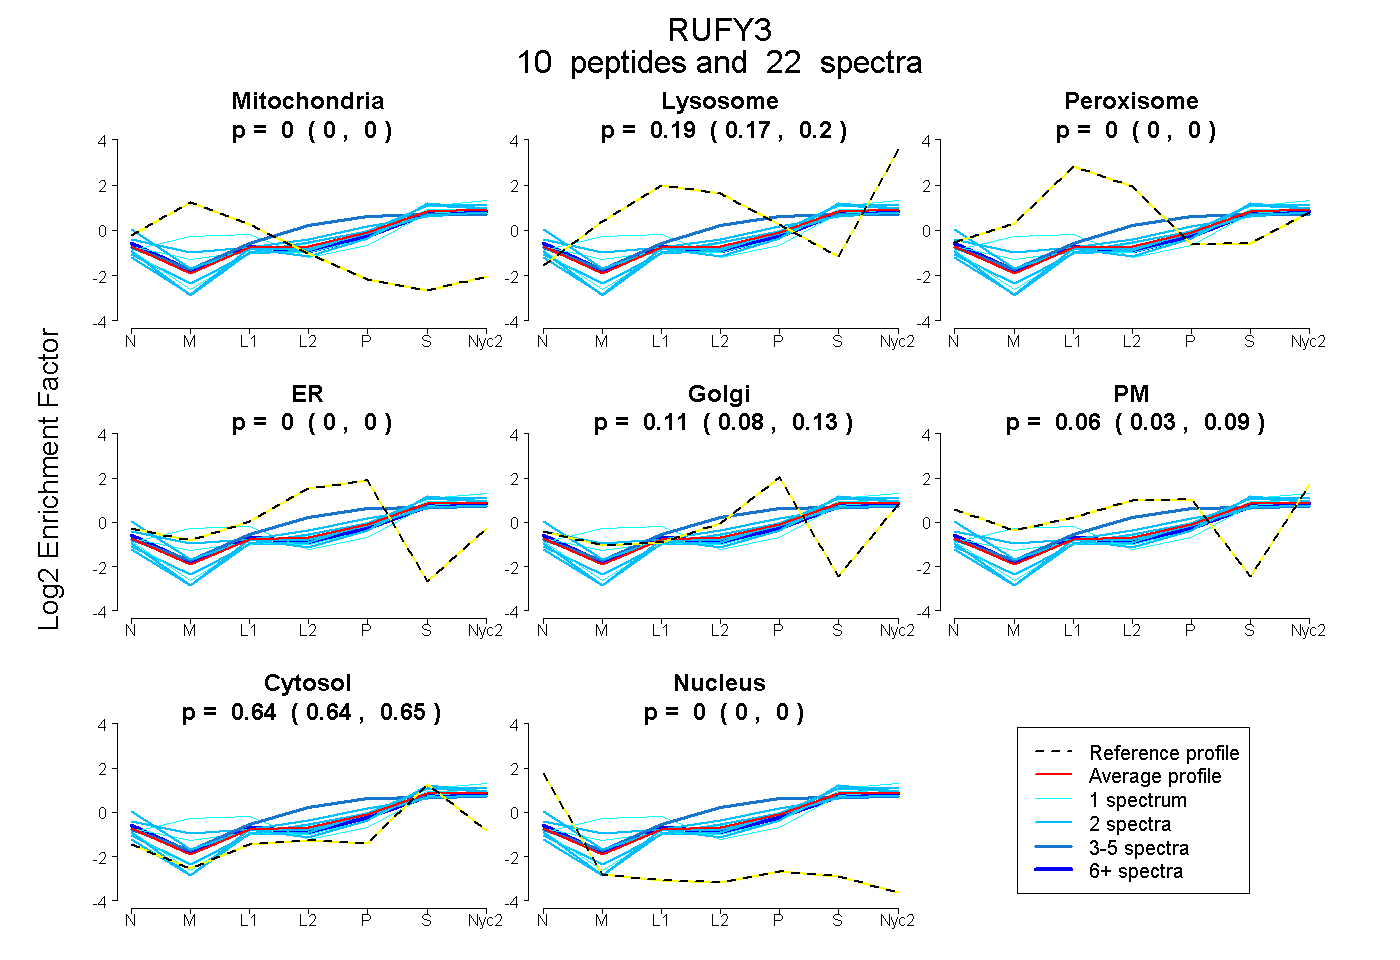
| Plot | Mito | Lyso | Perox | ER | Golgi | PM | Cytosol | Nucleus | |||||
| Expt A |
10 peptides |
22 spectra |
|
0.000 0.000 | 0.000 |
0.187 0.174 | 0.198 |
0.000 0.000 | 0.000 |
0.000 0.000 | 0.000 |
0.105 0.080 | 0.128 |
0.064 0.032 | 0.091 |
0.643 0.635 | 0.650 |
0.000 0.000 | 0.000 |
| 2 spectra, HELAFK | 0.000 | 0.141 | 0.000 | 0.000 | 0.046 | 0.263 | 0.550 | 0.000 | ||
| 2 spectra, VDALEK | 0.000 | 0.019 | 0.000 | 0.000 | 0.000 | 0.363 | 0.618 | 0.000 | ||
| 2 spectra, IITLQEEMER | 0.000 | 0.170 | 0.000 | 0.000 | 0.122 | 0.000 | 0.708 | 0.000 | ||
| 3 spectra, QQLDDLR | 0.000 | 0.226 | 0.000 | 0.077 | 0.180 | 0.000 | 0.518 | 0.000 | ||
| 1 spectrum, LVPEAAEITASVK | 0.000 | 0.197 | 0.000 | 0.000 | 0.040 | 0.094 | 0.669 | 0.000 | ||
| 1 spectrum, GSEGDGQITAILDQK | 0.105 | 0.336 | 0.000 | 0.000 | 0.000 | 0.000 | 0.559 | 0.000 | ||
| 6 spectra, GLIESALNLGR | 0.000 | 0.141 | 0.000 | 0.000 | 0.023 | 0.178 | 0.658 | 0.000 | ||
| 1 spectrum, QDALVSLR | 0.000 | 0.200 | 0.000 | 0.000 | 0.126 | 0.000 | 0.674 | 0.000 | ||
| 2 spectra, TAEGQALSEAR | 0.000 | 0.183 | 0.000 | 0.000 | 0.114 | 0.000 | 0.703 | 0.000 | ||
| 2 spectra, SFWGPLELVEK | 0.000 | 0.182 | 0.000 | 0.000 | 0.038 | 0.000 | 0.780 | 0.000 |
| Plot | Mito | Lyso or Perox | ER | Golgi | PM | Cytosol | Nucleus | ||||||
| Expt B |
7 peptides |
10 spectra |
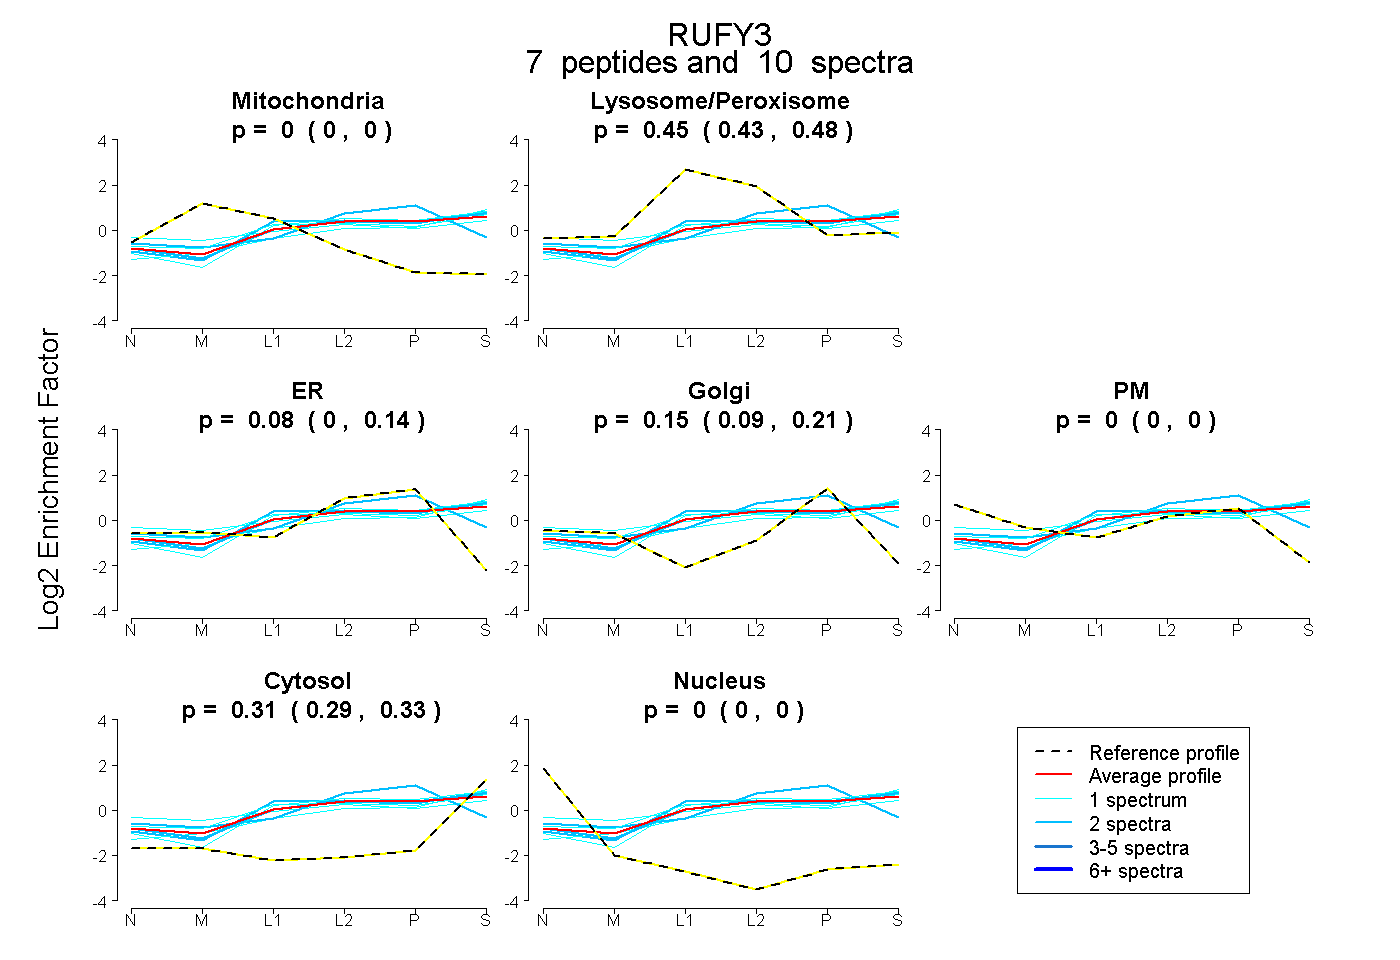 |
0.000 0.000 | 0.000 |
0.453 0.426 | 0.477 |
0.081 0.004 | 0.135 |
0.151 0.092 | 0.208 |
0.000 0.000 | 0.000 |
0.315 0.290 | 0.335 |
0.000 0.000 | 0.000 |
|||
| Plot | Lyso | Other | |||||||||||
| Expt C |
17 peptides |
60 spectra |
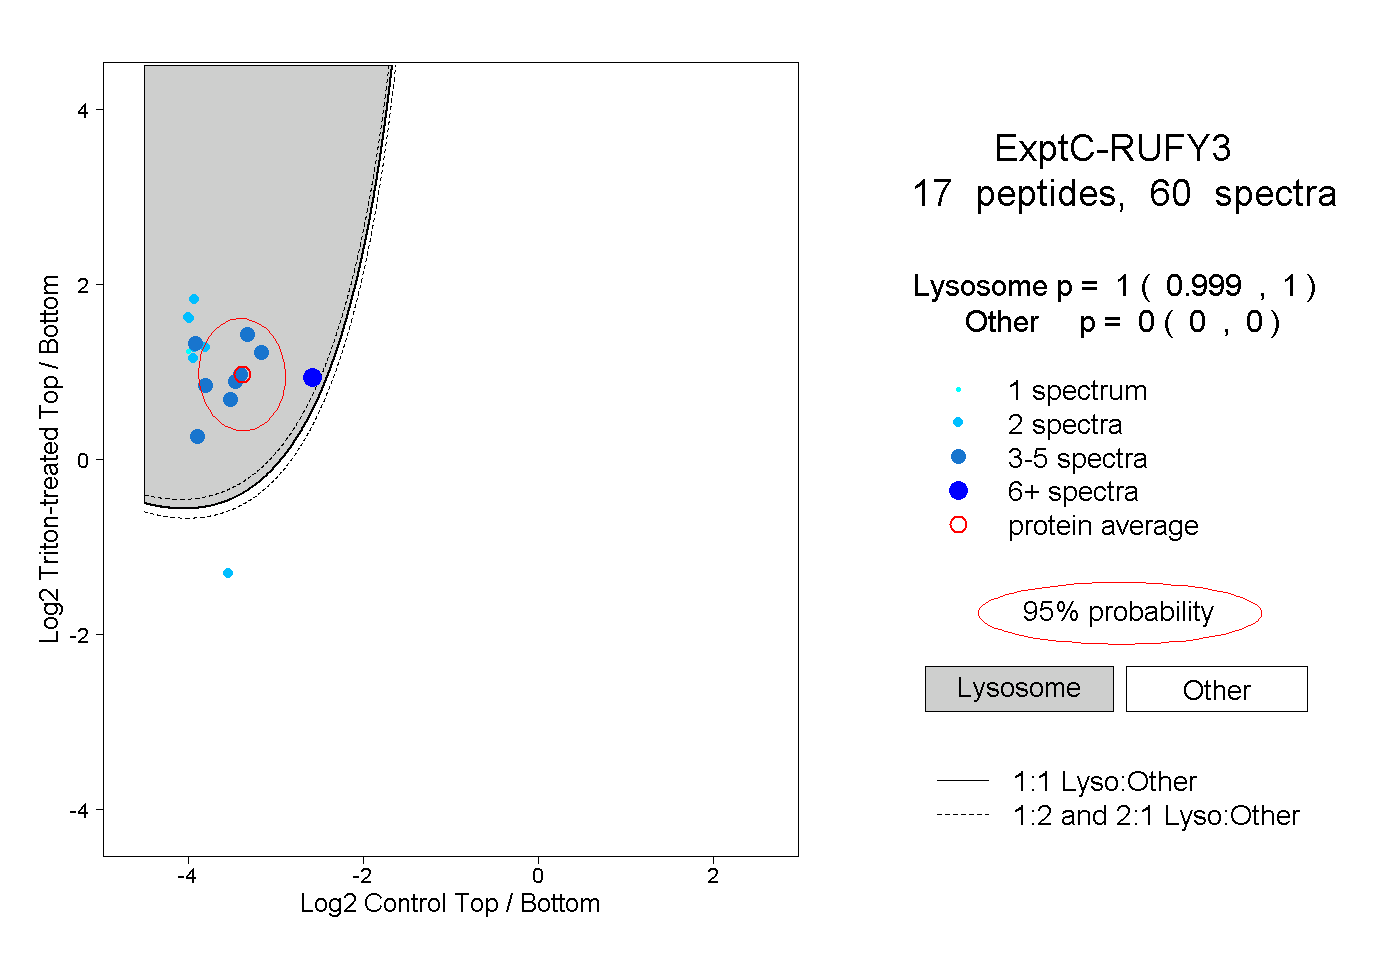 |
1.000 0.999 | 1.000 |
0.000 0.000 | 0.000 |
||||||||
| Plot | Lyso | Other | |||||||||||
| Expt D |
3 peptides |
4 spectra |
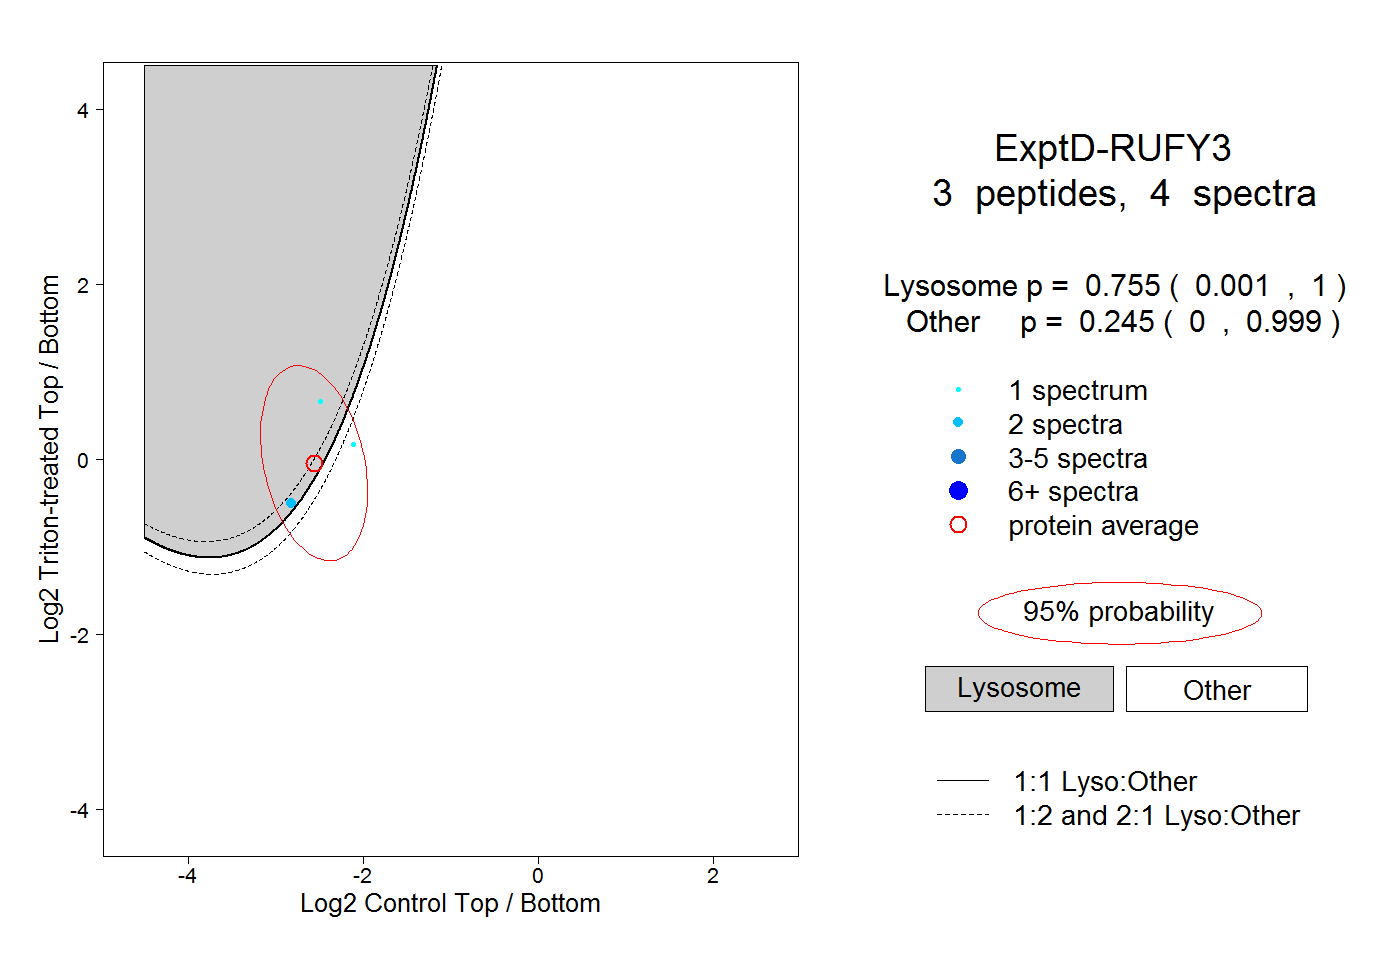 |
0.755 0.001 | 1.000 |
0.245 0.000 | 0.999 |