 7
7peptides
spectra
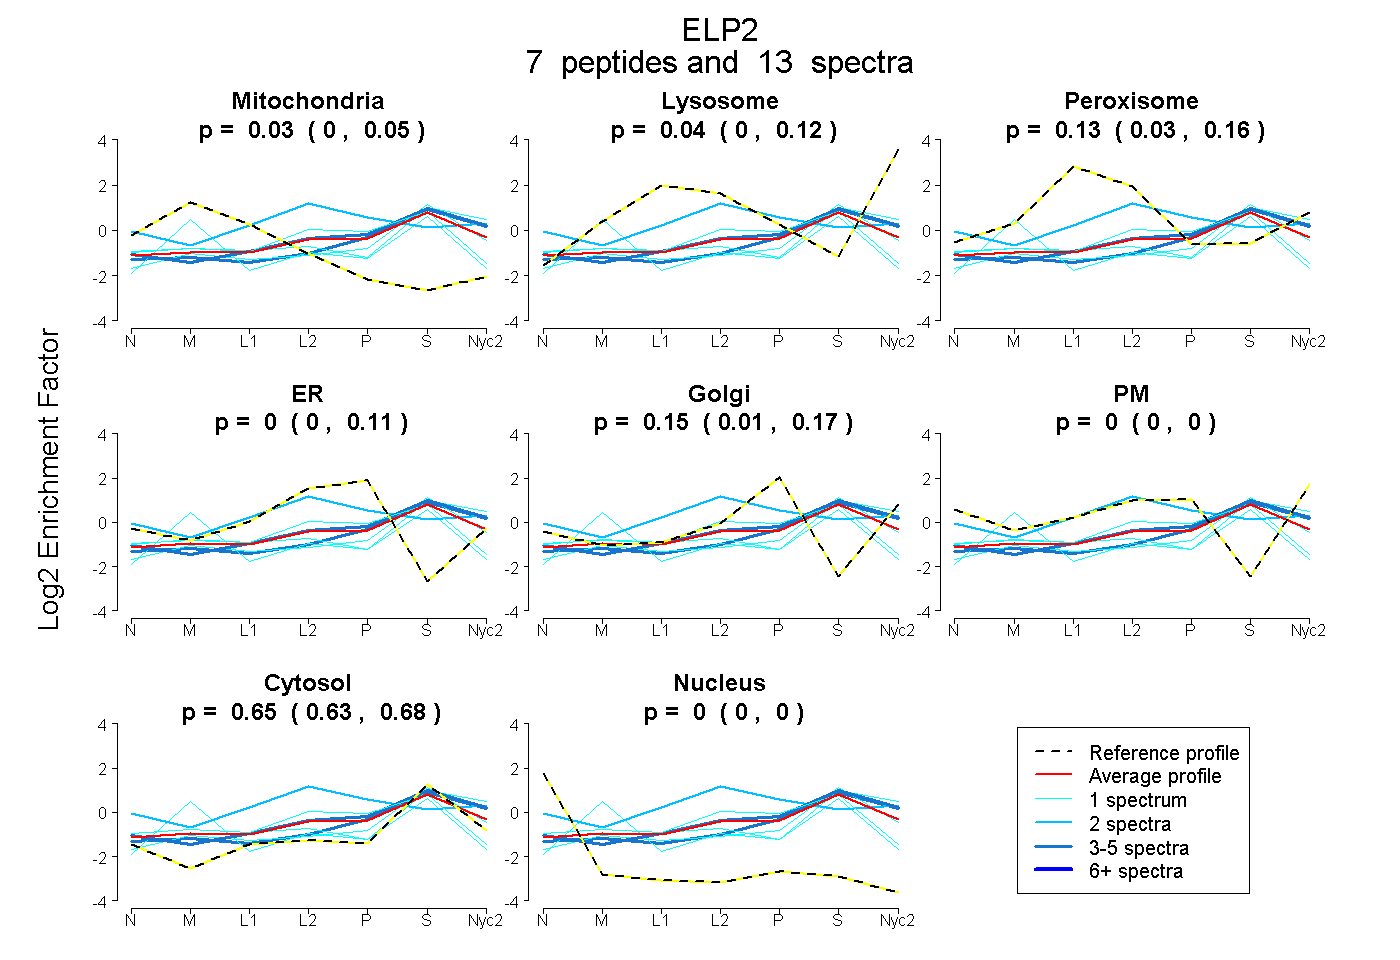
0.001 | 0.054
0.000 | 0.118
0.026 | 0.164
0.000 | 0.114
0.008 | 0.173
0.000 | 0.000
0.630 | 0.677
0.000 | 0.000
2peptides
spectra
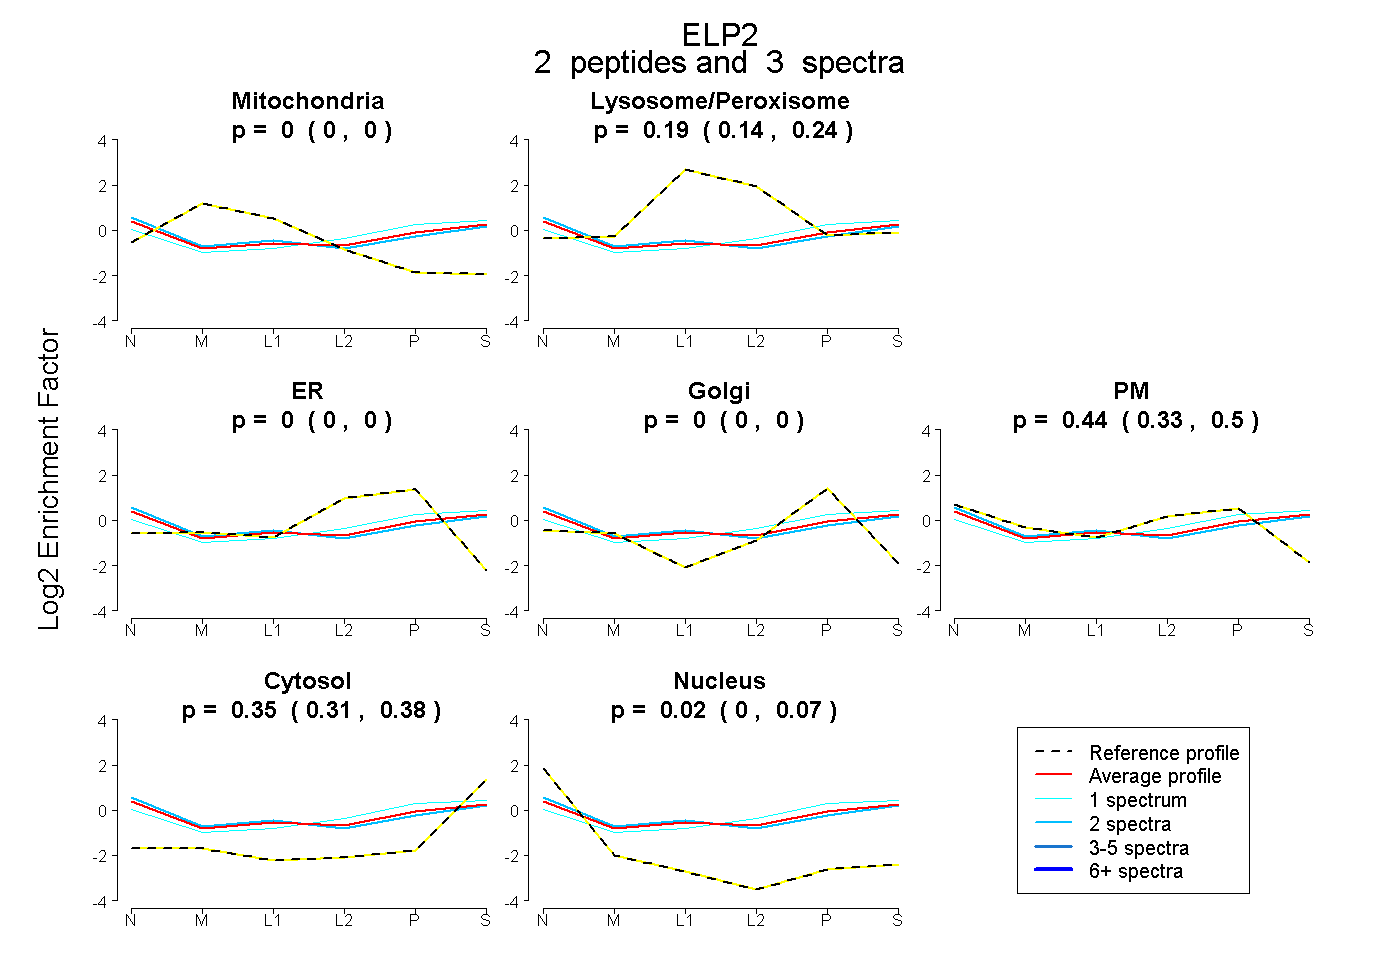
0.000 | 0.000
0.139 | 0.243
0.000 | 0.000
0.000 | 0.000
0.332 | 0.500
0.306 | 0.381
0.000 | 0.074
6peptides
spectra
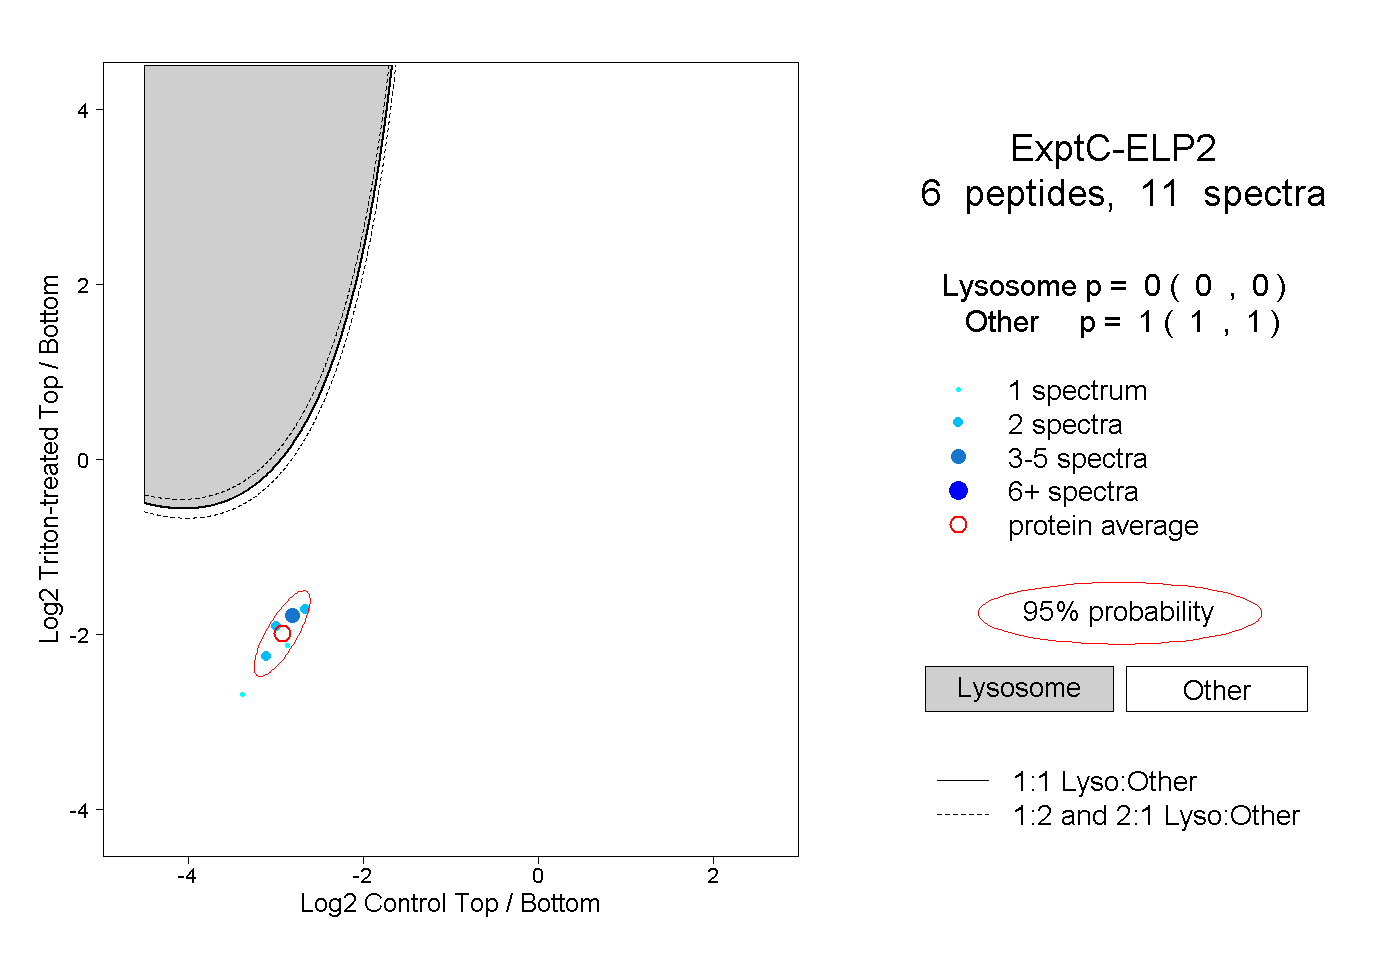
0.000 | 0.000
1.000 | 1.000