 9
9peptides
spectra
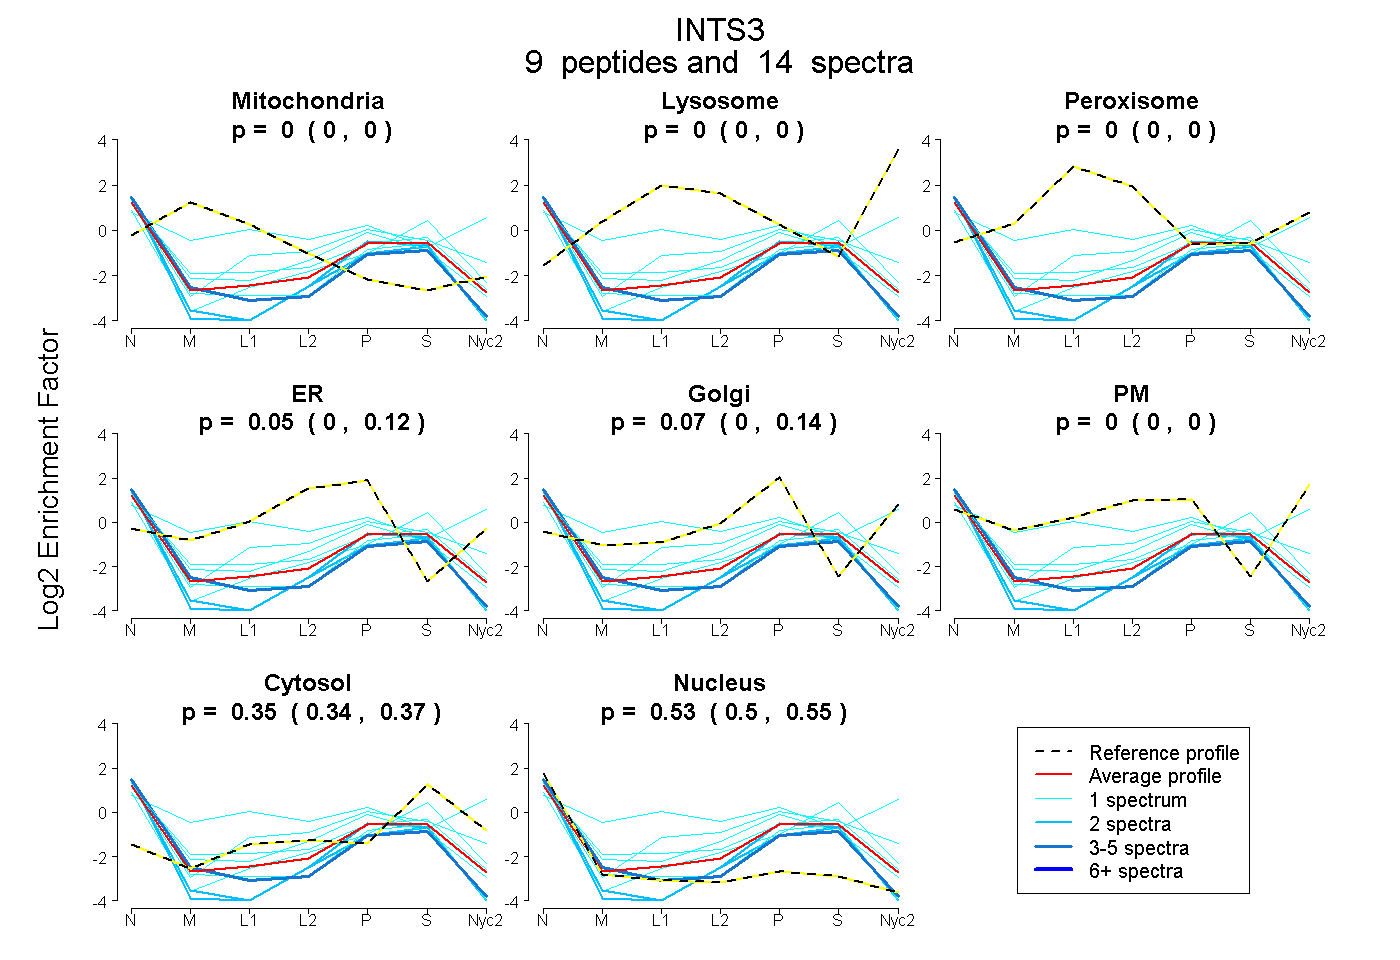
0.000 | 0.000
0.000 | 0.000
0.000 | 0.000
0.000 | 0.117
0.000 | 0.136
0.000 | 0.000
0.335 | 0.366
0.502 | 0.547
| Plot | Mito | Lyso | Perox | ER | Golgi | PM | Cytosol | Nucleus | |||||
| Expt A |
9 peptides |
14 spectra |
|
0.000 0.000 | 0.000 |
0.000 0.000 | 0.000 |
0.000 0.000 | 0.000 |
0.051 0.000 | 0.117 |
0.072 0.000 | 0.136 |
0.000 0.000 | 0.000 |
0.352 0.335 | 0.366 |
0.526 0.502 | 0.547 |
| 2 spectra, IPEFELLWK | 0.000 | 0.000 | 0.000 | 0.000 | 0.000 | 0.000 | 0.267 | 0.733 | ||
| 1 spectrum, YQDWFQR | 0.000 | 0.000 | 0.000 | 0.184 | 0.000 | 0.000 | 0.379 | 0.437 | ||
| 2 spectra, HDELLAEHIK | 0.000 | 0.000 | 0.000 | 0.000 | 0.000 | 0.000 | 0.240 | 0.760 | ||
| 1 spectrum, LLFMTSR | 0.000 | 0.000 | 0.000 | 0.266 | 0.000 | 0.000 | 0.233 | 0.500 | ||
| 1 spectrum, DLALVSR | 0.000 | 0.000 | 0.000 | 0.000 | 0.000 | 0.000 | 0.592 | 0.408 | ||
| 1 spectrum, QYLSTPDSQSLR | 0.000 | 0.000 | 0.000 | 0.000 | 0.000 | 0.000 | 0.300 | 0.700 | ||
| 1 spectrum, AALSSPR | 0.000 | 0.000 | 0.000 | 0.247 | 0.000 | 0.077 | 0.392 | 0.284 | ||
| 4 spectra, TQLVWLVR | 0.000 | 0.000 | 0.000 | 0.000 | 0.000 | 0.000 | 0.261 | 0.739 | ||
| 1 spectrum, INQLLMEK | 0.053 | 0.000 | 0.088 | 0.000 | 0.000 | 0.554 | 0.254 | 0.051 |
| Plot | Mito | Lyso or Perox | ER | Golgi | PM | Cytosol | Nucleus | ||||||
| Expt B |
2 peptides |
2 spectra |
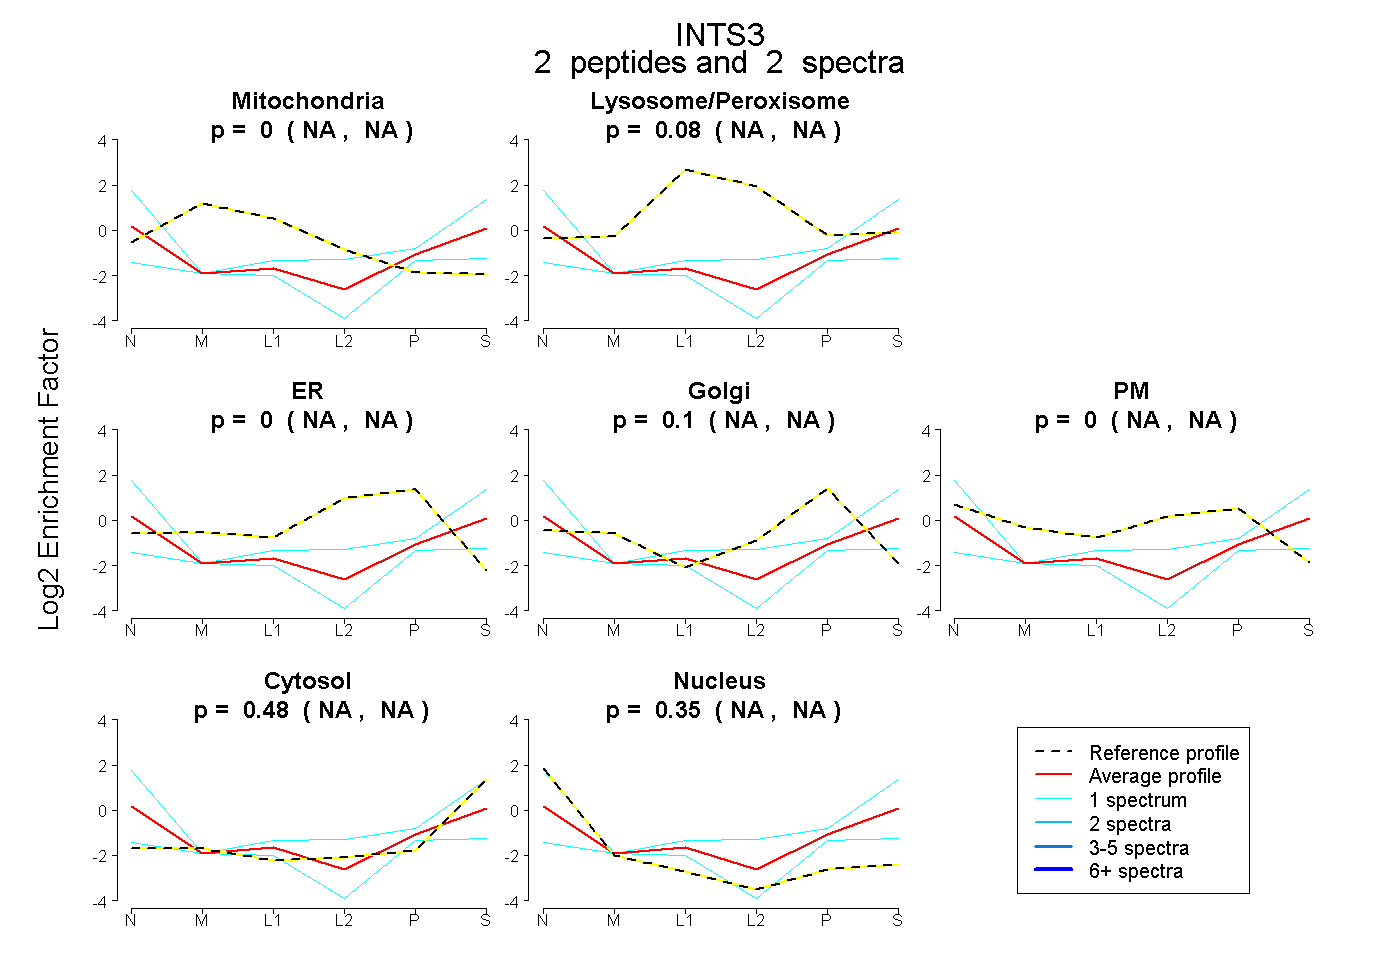 |
0.000 NA | NA |
0.080 NA | NA |
0.000 NA | NA |
0.095 NA | NA |
0.000 NA | NA |
0.477 NA | NA |
0.348 NA | NA |