 2
2peptides
spectra
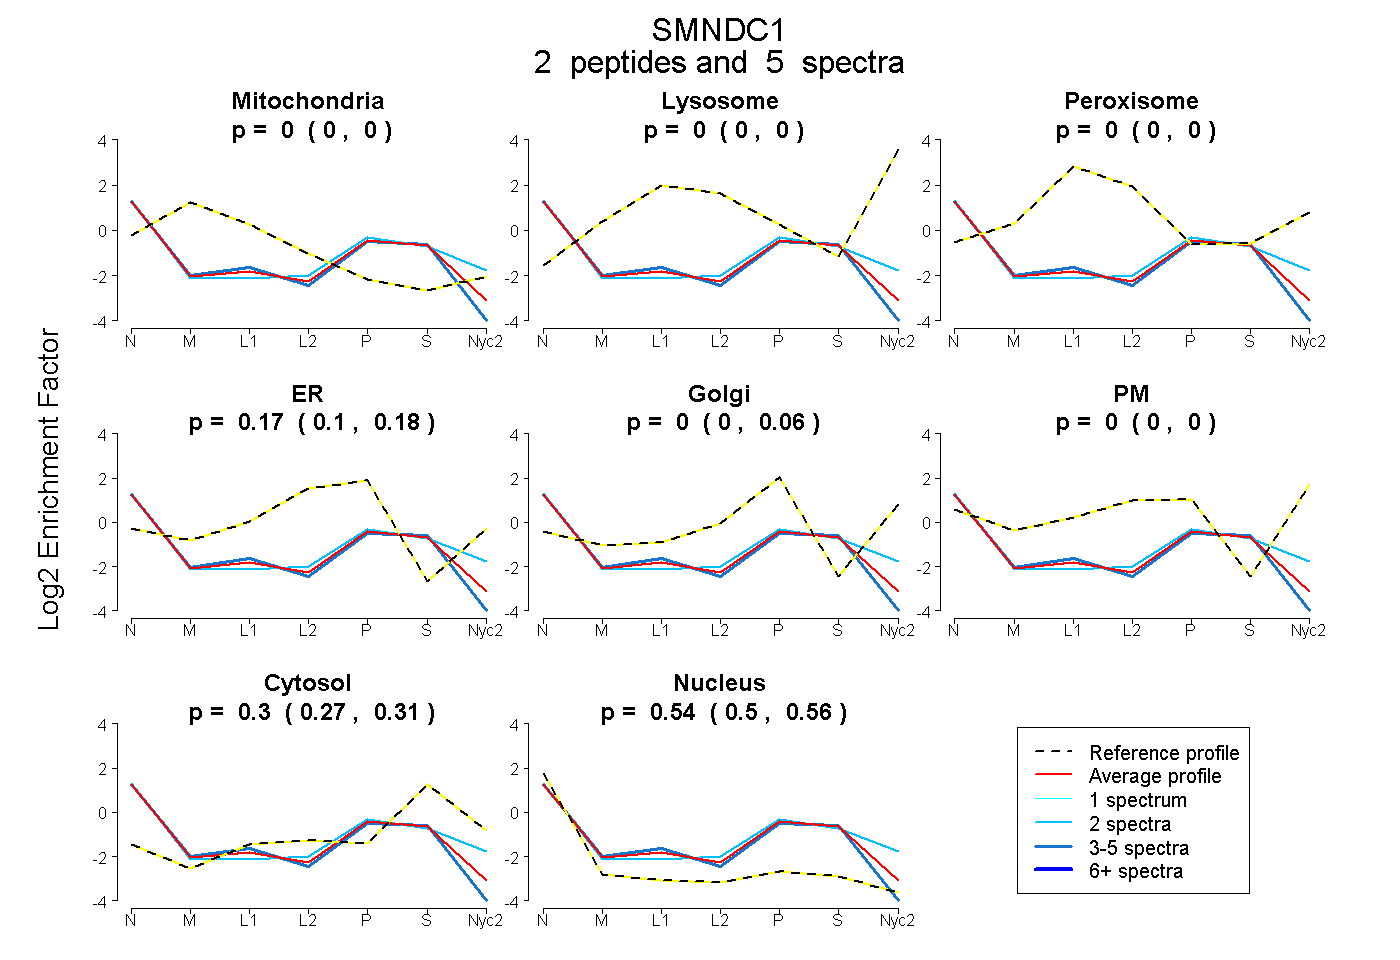
0.000 | 0.000
0.000 | 0.000
0.000 | 0.000
0.096 | 0.182
0.000 | 0.063
0.000 | 0.000
0.274 | 0.314
0.497 | 0.564
1peptide
spectrum
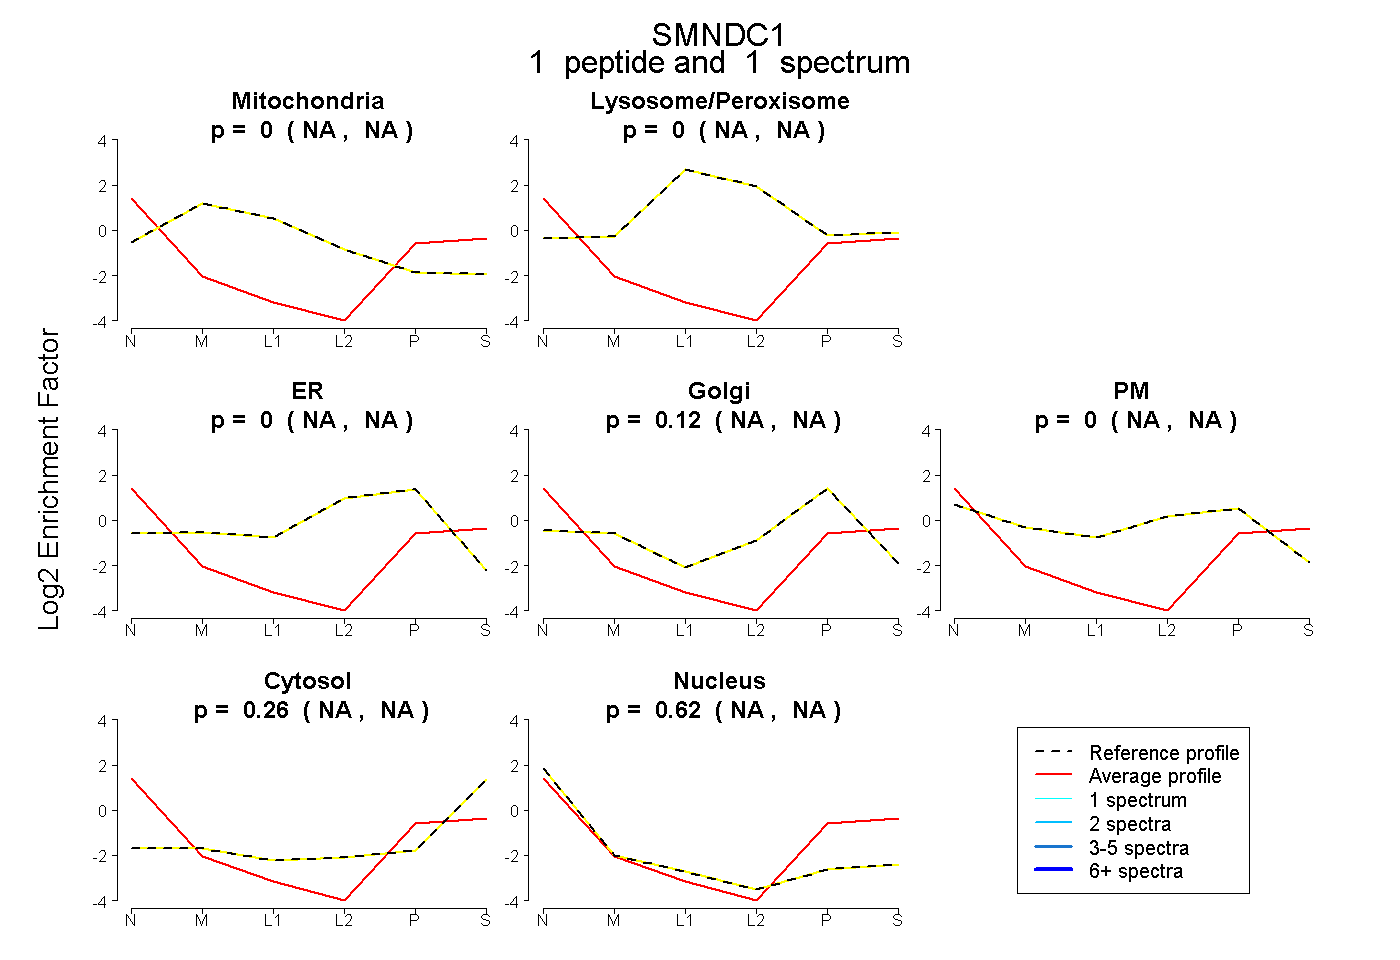
NA | NA
NA | NA
NA | NA
NA | NA
NA | NA
NA | NA
NA | NA
| Plot | Mito | Lyso | Perox | ER | Golgi | PM | Cytosol | Nucleus | |||||
| Expt A |
2 peptides |
5 spectra |
|
0.000 0.000 | 0.000 |
0.000 0.000 | 0.000 |
0.000 0.000 | 0.000 |
0.166 0.096 | 0.182 |
0.000 0.000 | 0.063 |
0.000 0.000 | 0.000 |
0.299 0.274 | 0.314 |
0.535 0.497 | 0.564 |
||
| Plot | Mito | Lyso or Perox | ER | Golgi | PM | Cytosol | Nucleus | ||||||
| Expt B |
1 peptide |
1 spectrum |
|
0.000 NA | NA |
0.000 NA | NA |
0.000 NA | NA |
0.119 NA | NA |
0.000 NA | NA |
0.261 NA | NA |
0.620 NA | NA |
| 1 spectrum, DLQEVIELTK | 0.000 | 0.000 | 0.000 | 0.119 | 0.000 | 0.261 | 0.620 |
| Plot | Lyso | Other | |||||||||||
| Expt C |
1 peptide |
1 spectrum |
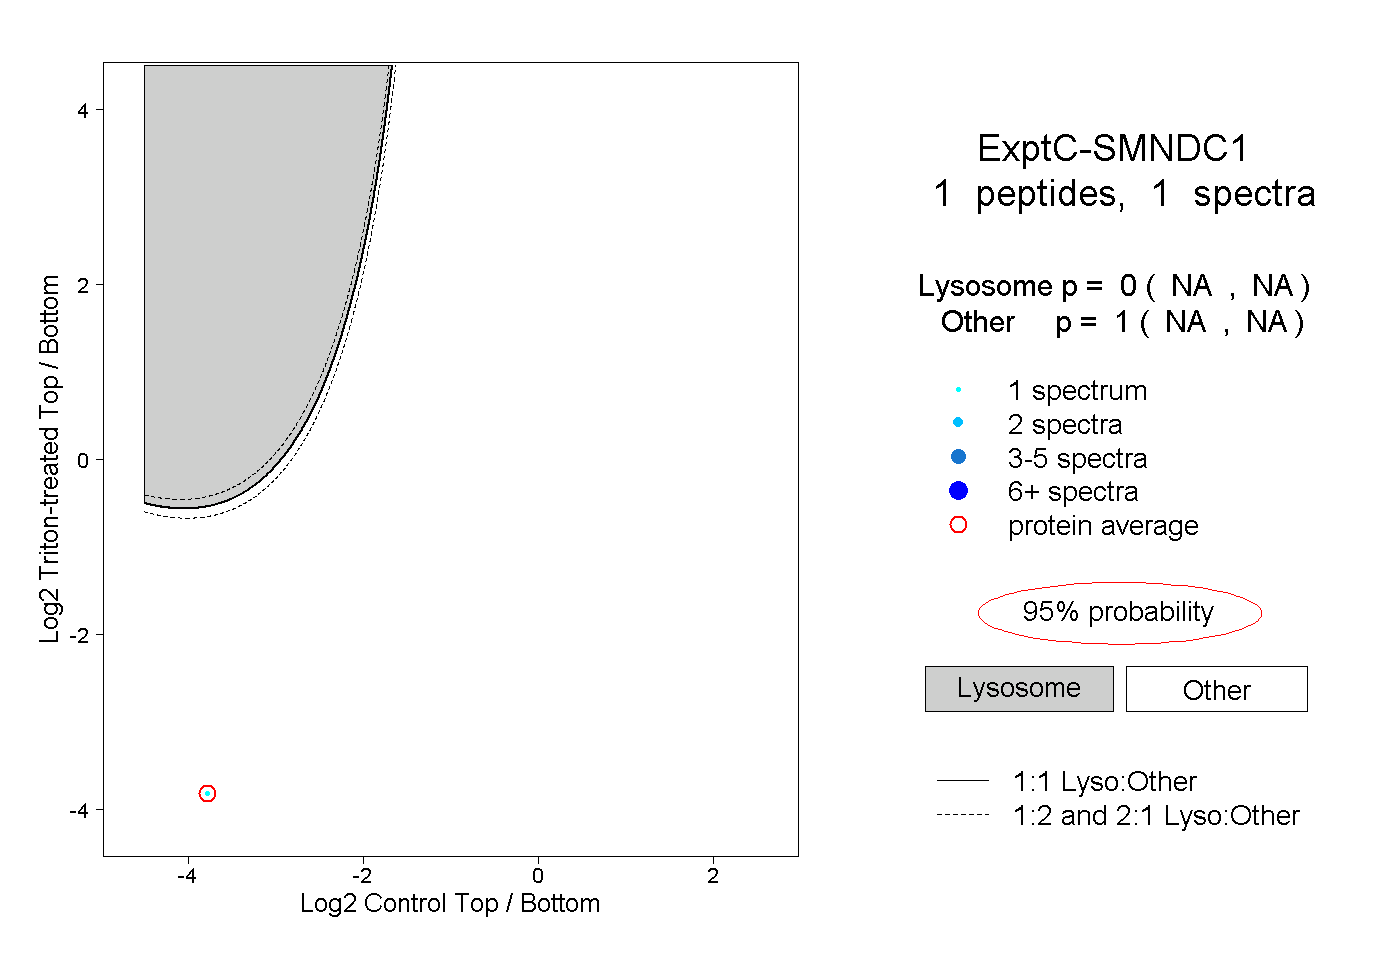 |
0.000 NA | NA |
1.000 NA | NA |