 30
30peptides
spectra
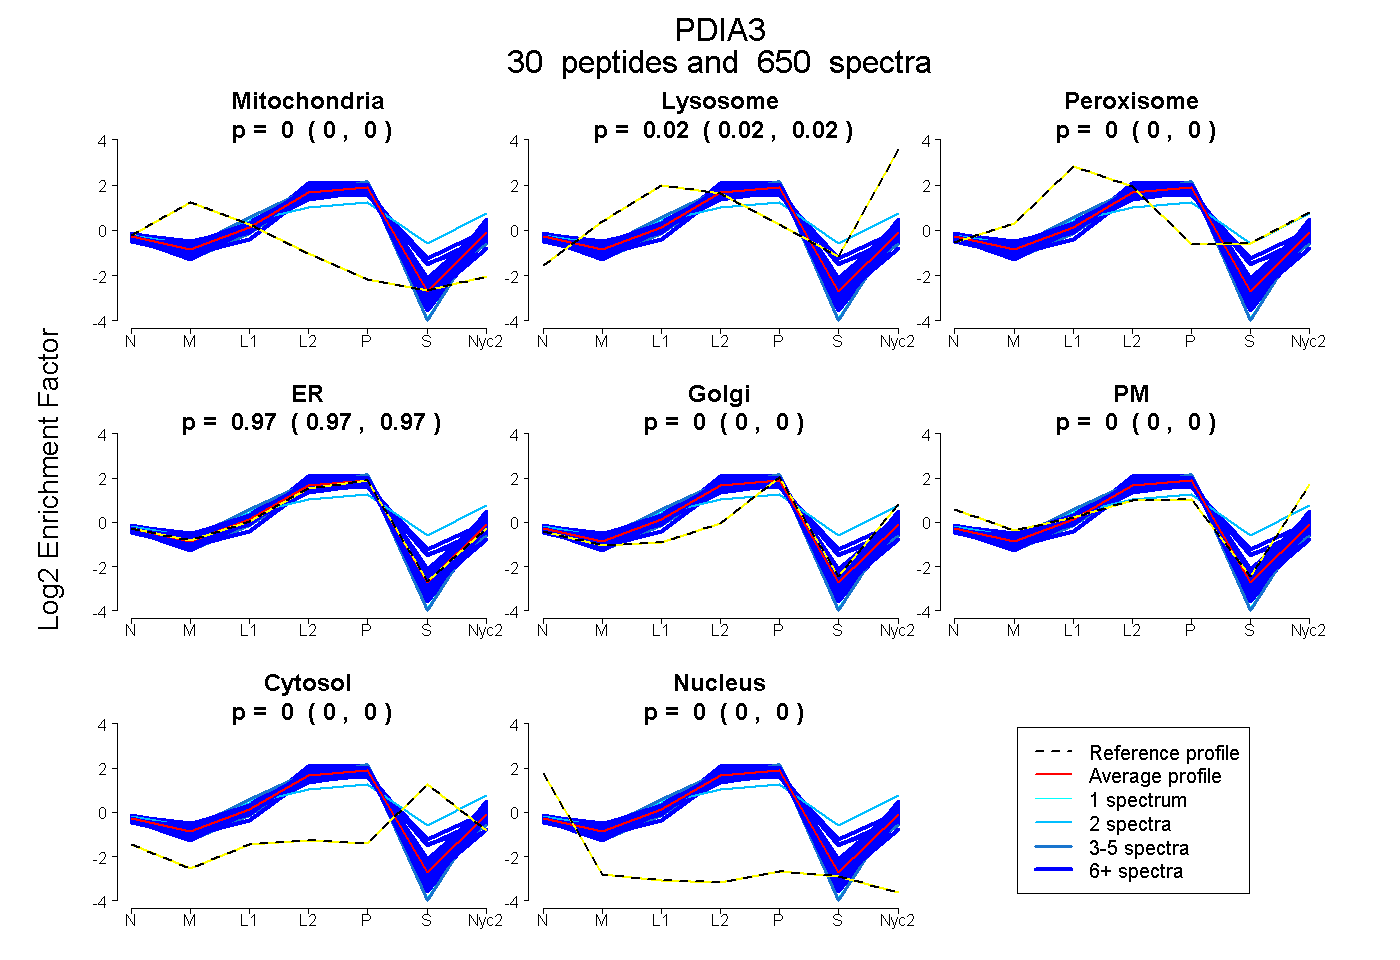
0.000 | 0.000
0.023 | 0.025
0.000 | 0.000
0.972 | 0.975
0.000 | 0.000
0.001 | 0.004
0.000 | 0.000
0.000 | 0.000
28peptides
spectra
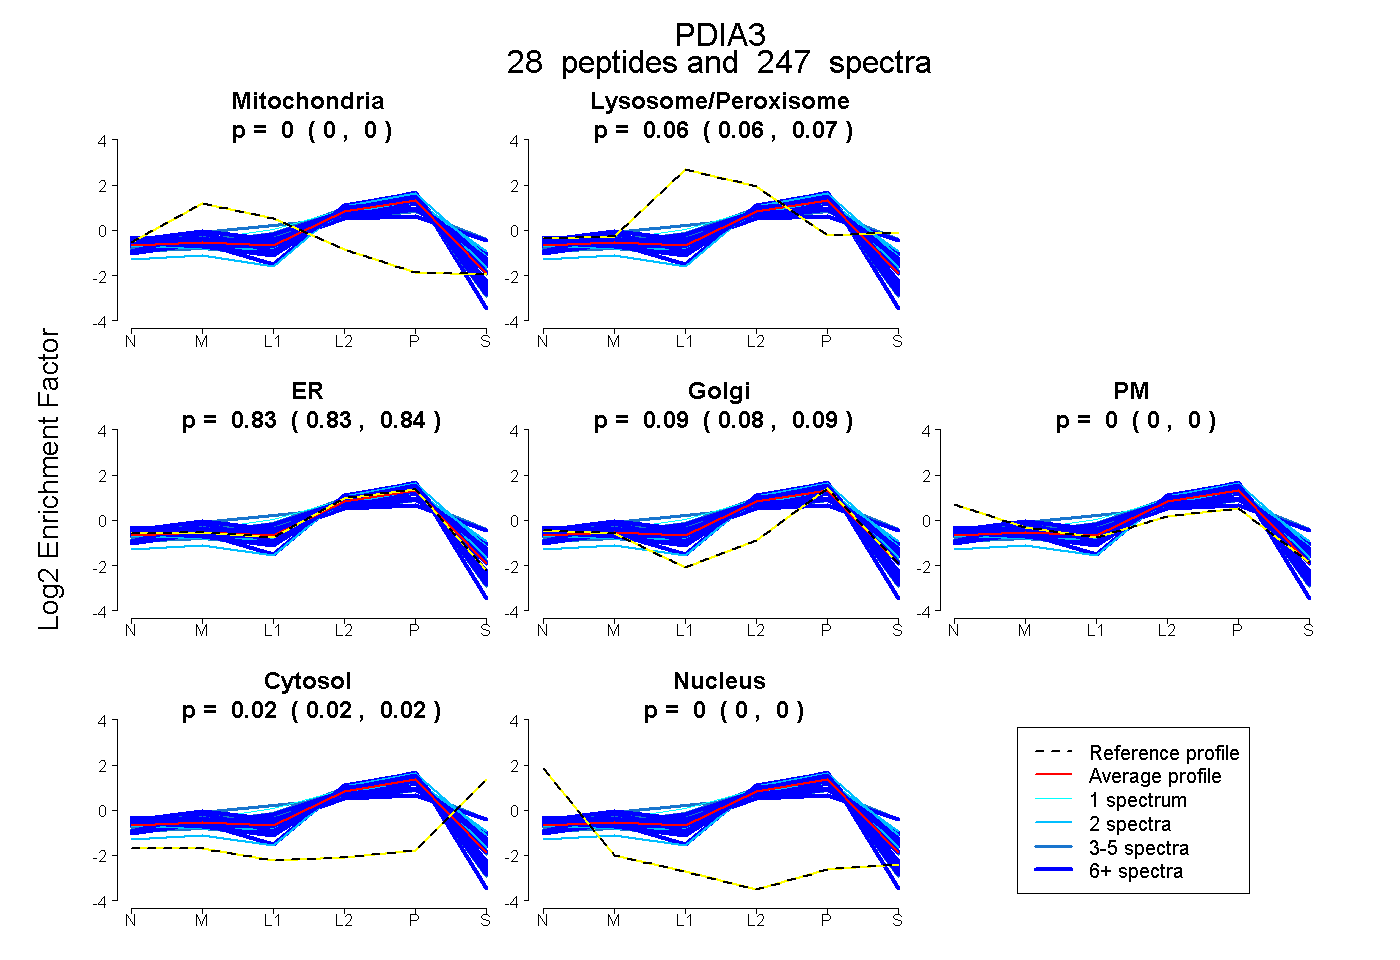
0.000 | 0.000
0.060 | 0.066
0.826 | 0.839
0.081 | 0.090
0.000 | 0.000
0.015 | 0.020
0.000 | 0.000
30peptides
spectra
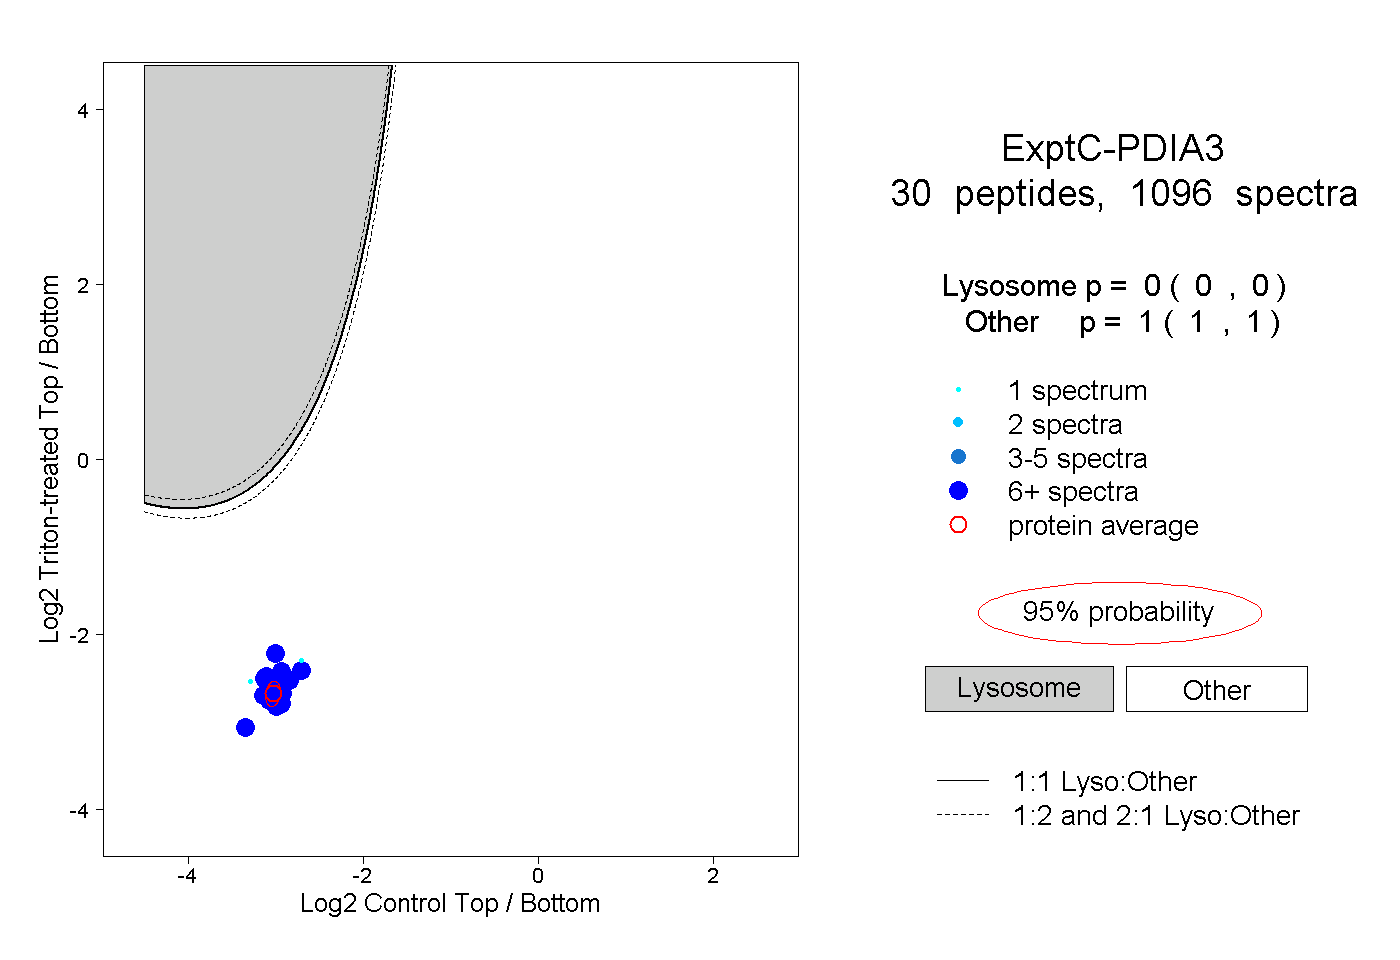
0.000 | 0.000
1.000 | 1.000
24peptides
spectra
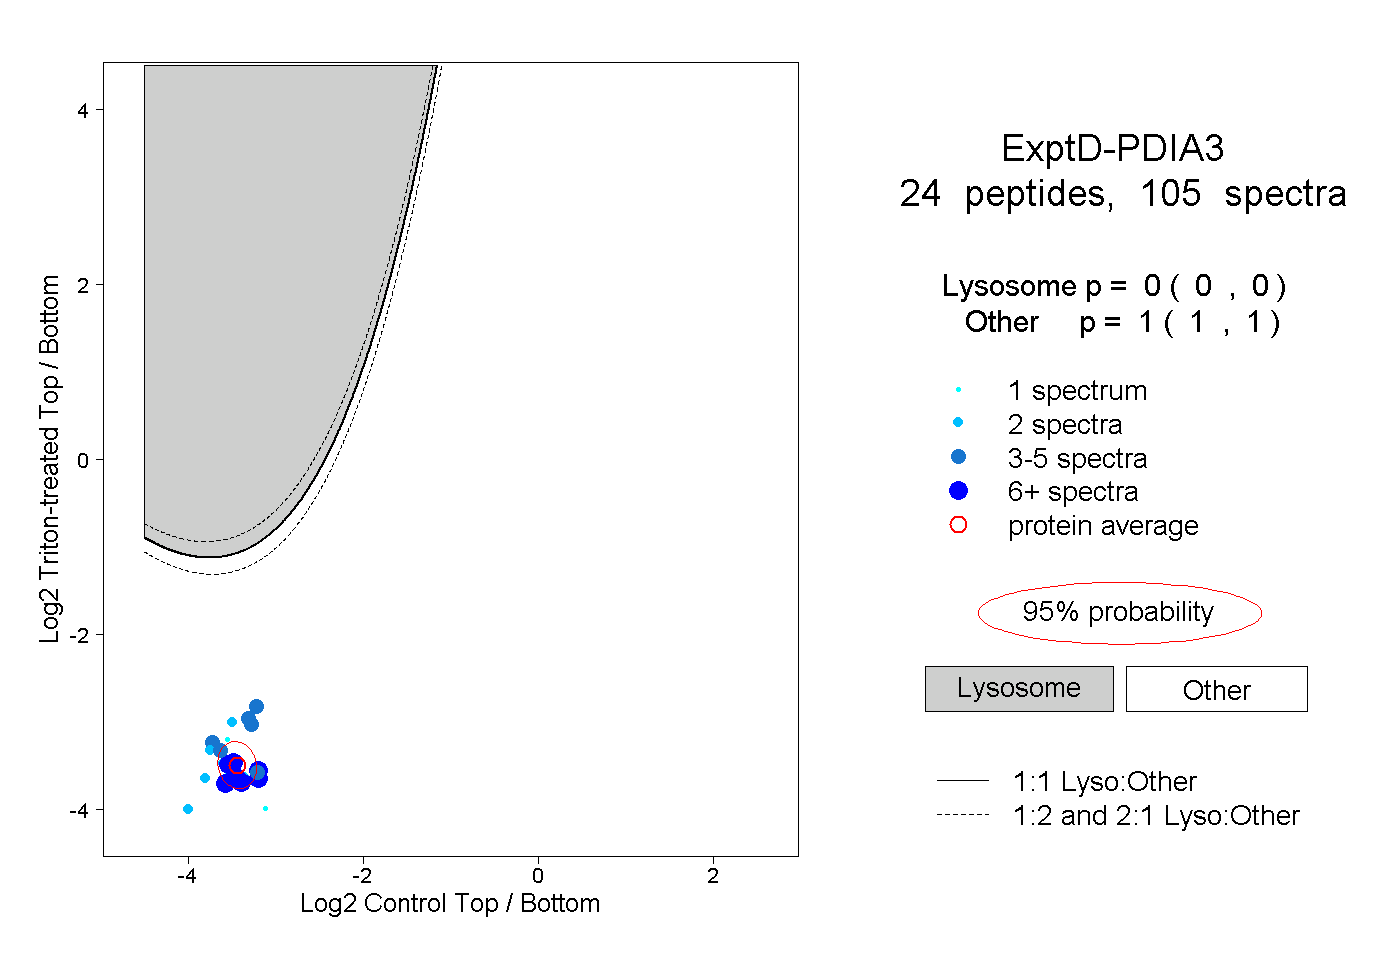
0.000 | 0.000
1.000 | 1.000