 2
2peptides
spectra
0.000 | 0.000
0.000 | 0.107
0.000 | 0.000
0.000 | 0.002
0.000 | 0.153
0.000 | 0.066
0.728 | 0.931
0.000 | 0.110
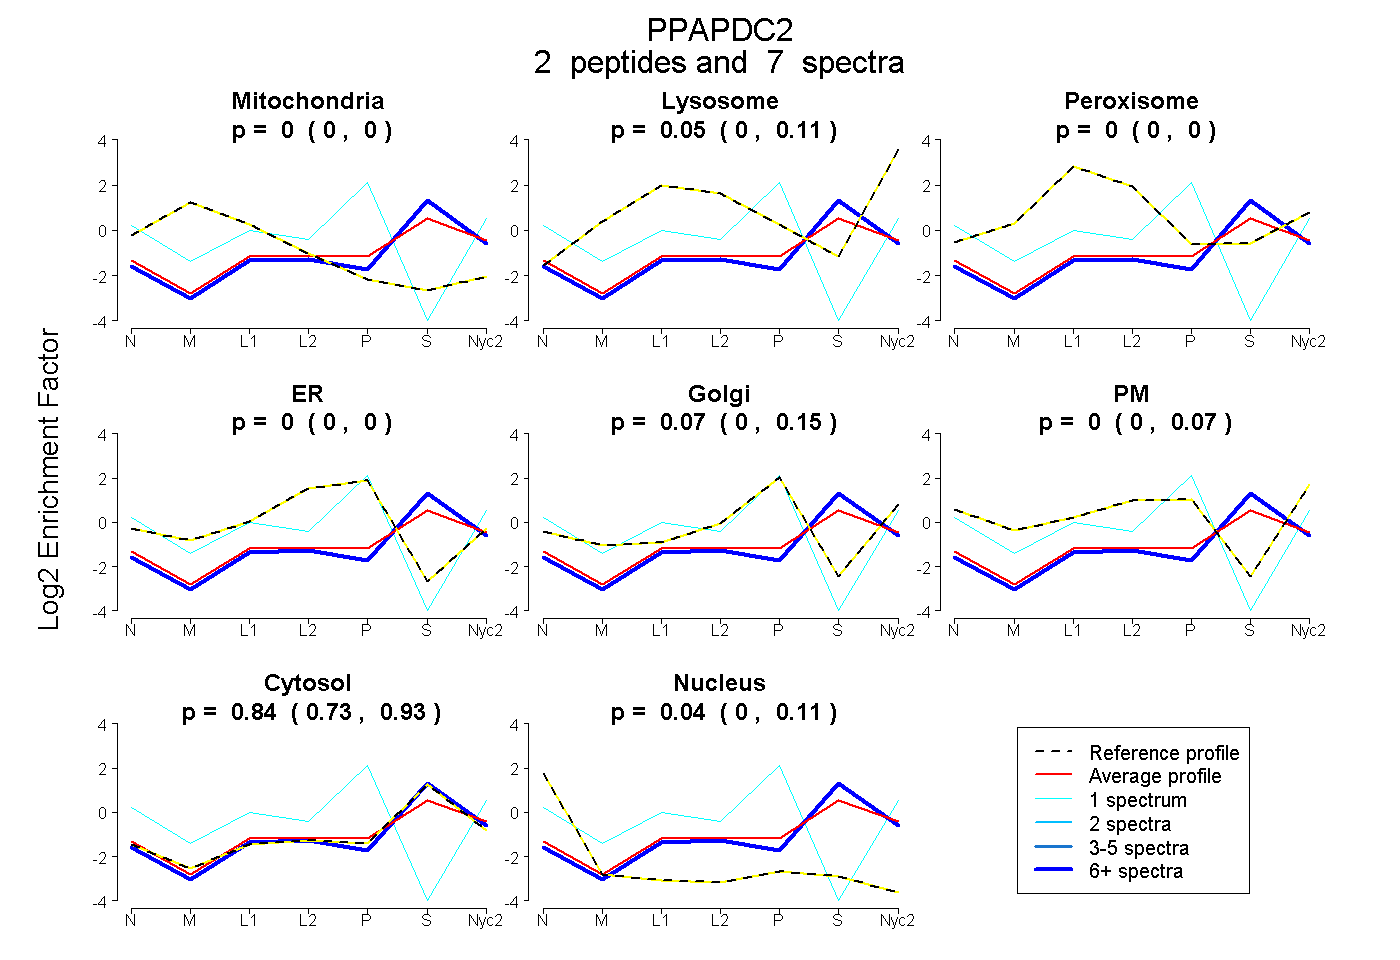
| Plot | Mito | Lyso | Perox | ER | Golgi | PM | Cytosol | Nucleus | |||||
| Expt A |
2 peptides |
7 spectra |
|
0.000 0.000 | 0.000 |
0.051 0.000 | 0.107 |
0.000 0.000 | 0.000 |
0.000 0.000 | 0.002 |
0.067 0.000 | 0.153 |
0.000 0.000 | 0.066 |
0.843 0.728 | 0.931 |
0.039 0.000 | 0.110 |
| 1 spectrum, FEFQSLLSCR | 0.000 | 0.000 | 0.000 | 0.159 | 0.692 | 0.098 | 0.000 | 0.051 | ||
| 6 spectra, MPSPR | 0.000 | 0.000 | 0.000 | 0.000 | 0.000 | 0.000 | 1.000 | 0.000 |