 12
12peptides
spectra
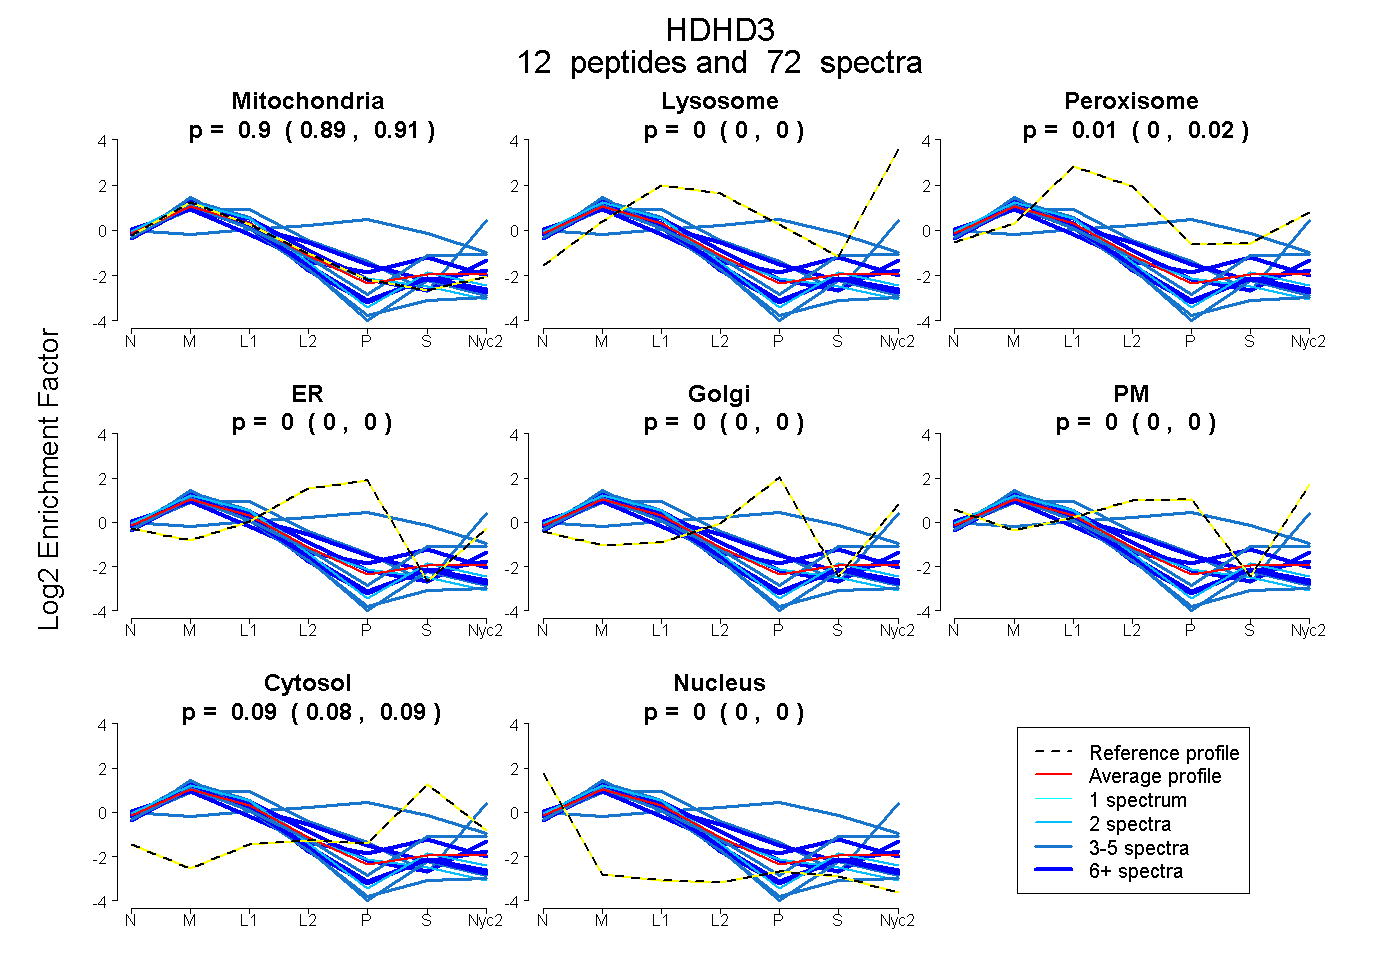
0.888 | 0.907
0.000 | 0.000
0.004 | 0.020
0.000 | 0.000
0.000 | 0.000
0.000 | 0.000
0.082 | 0.095
0.000 | 0.000
9peptides
spectra
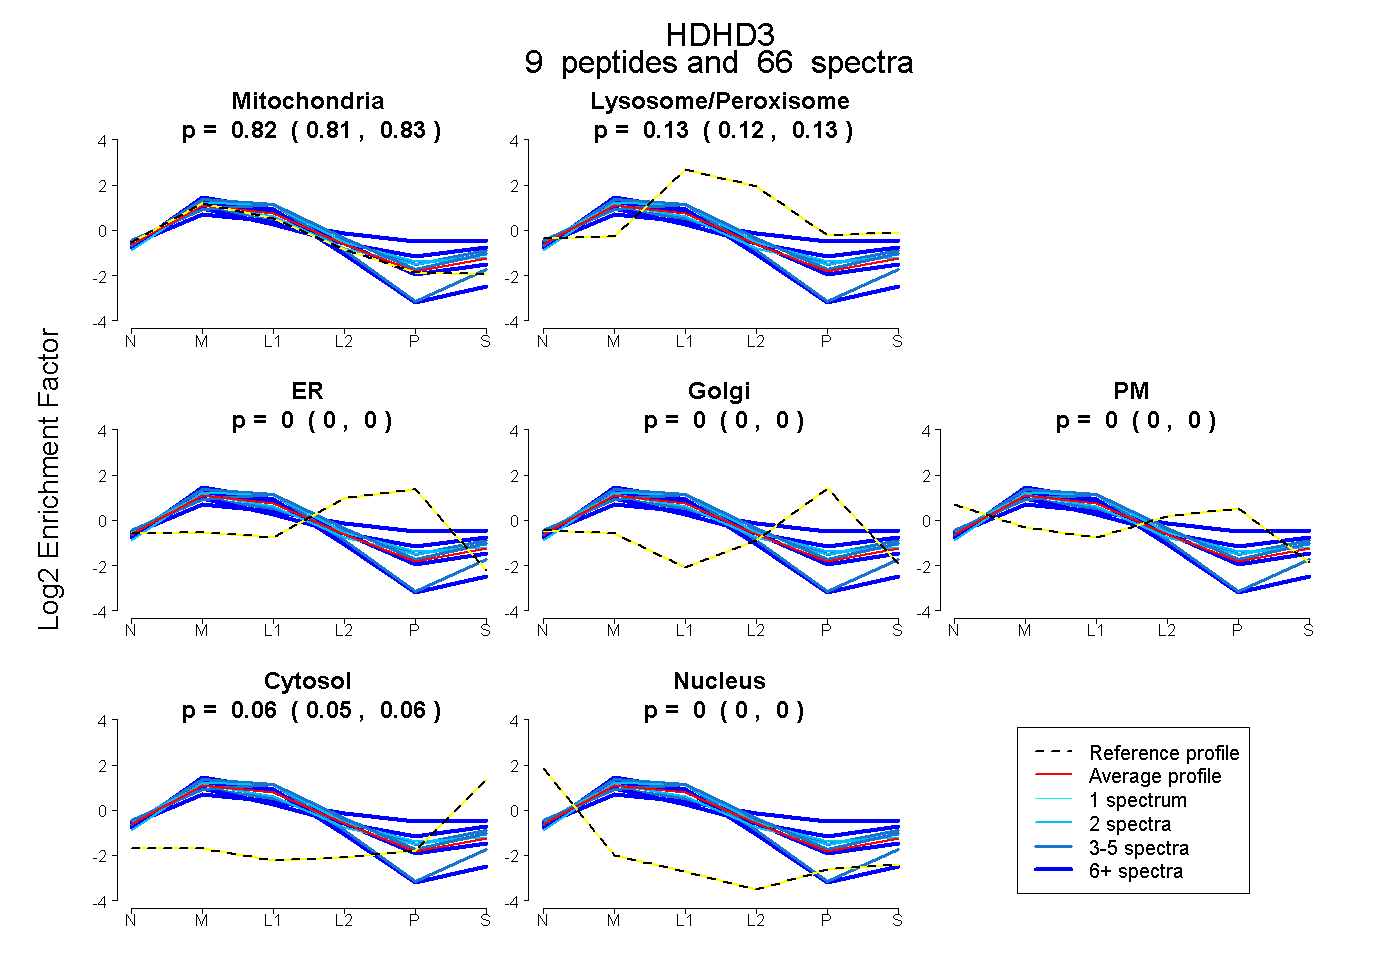
0.805 | 0.829
0.116 | 0.132
0.000 | 0.000
0.000 | 0.000
0.000 | 0.000
0.050 | 0.062
0.000 | 0.000
13peptides
spectra
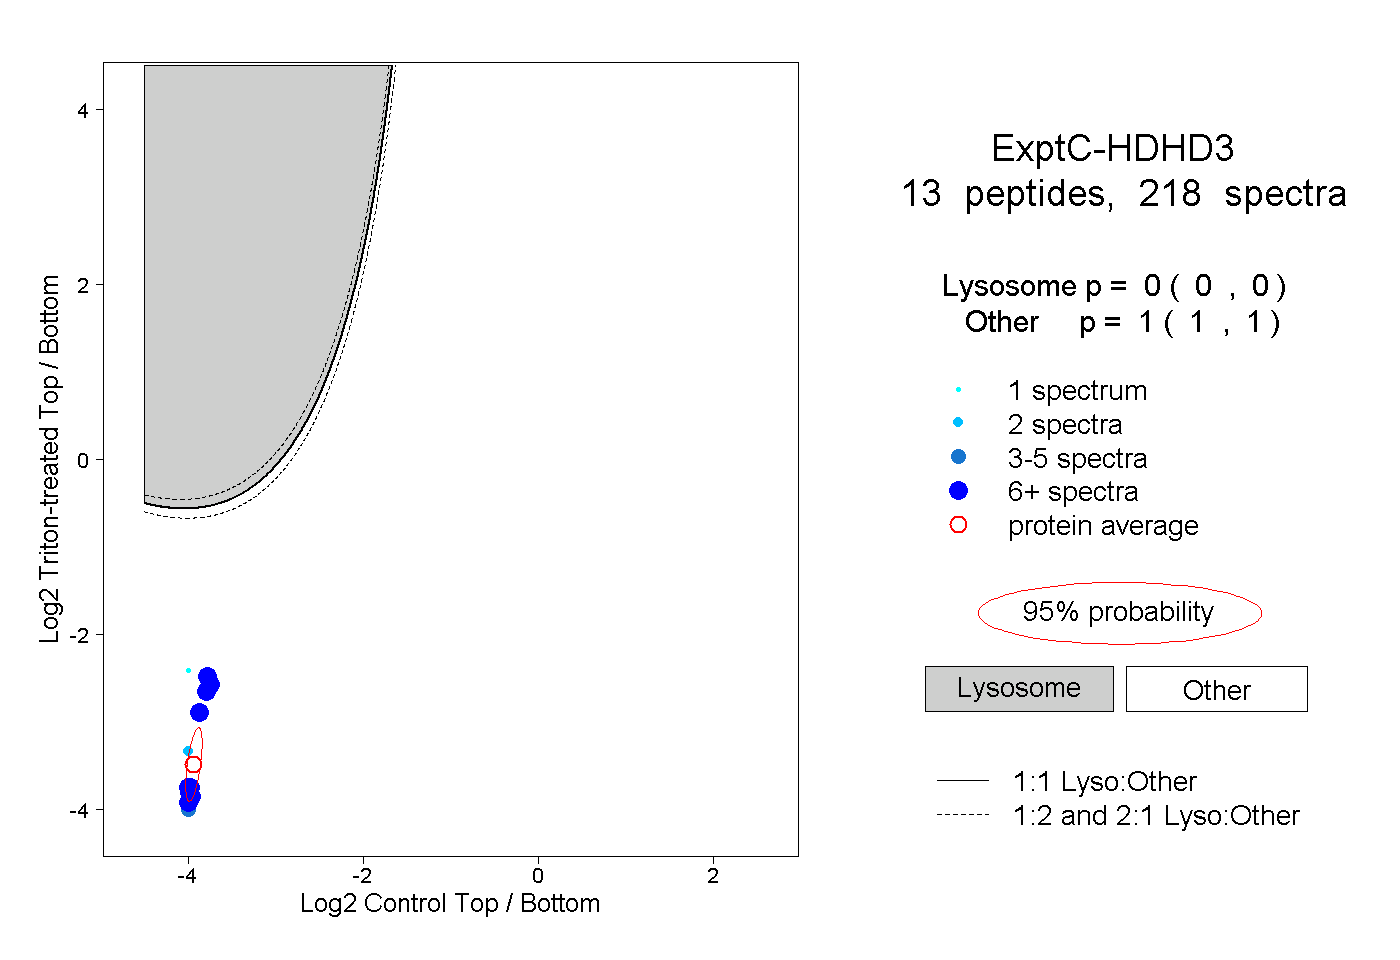
0.000 | 0.000
1.000 | 1.000
6peptides
spectra
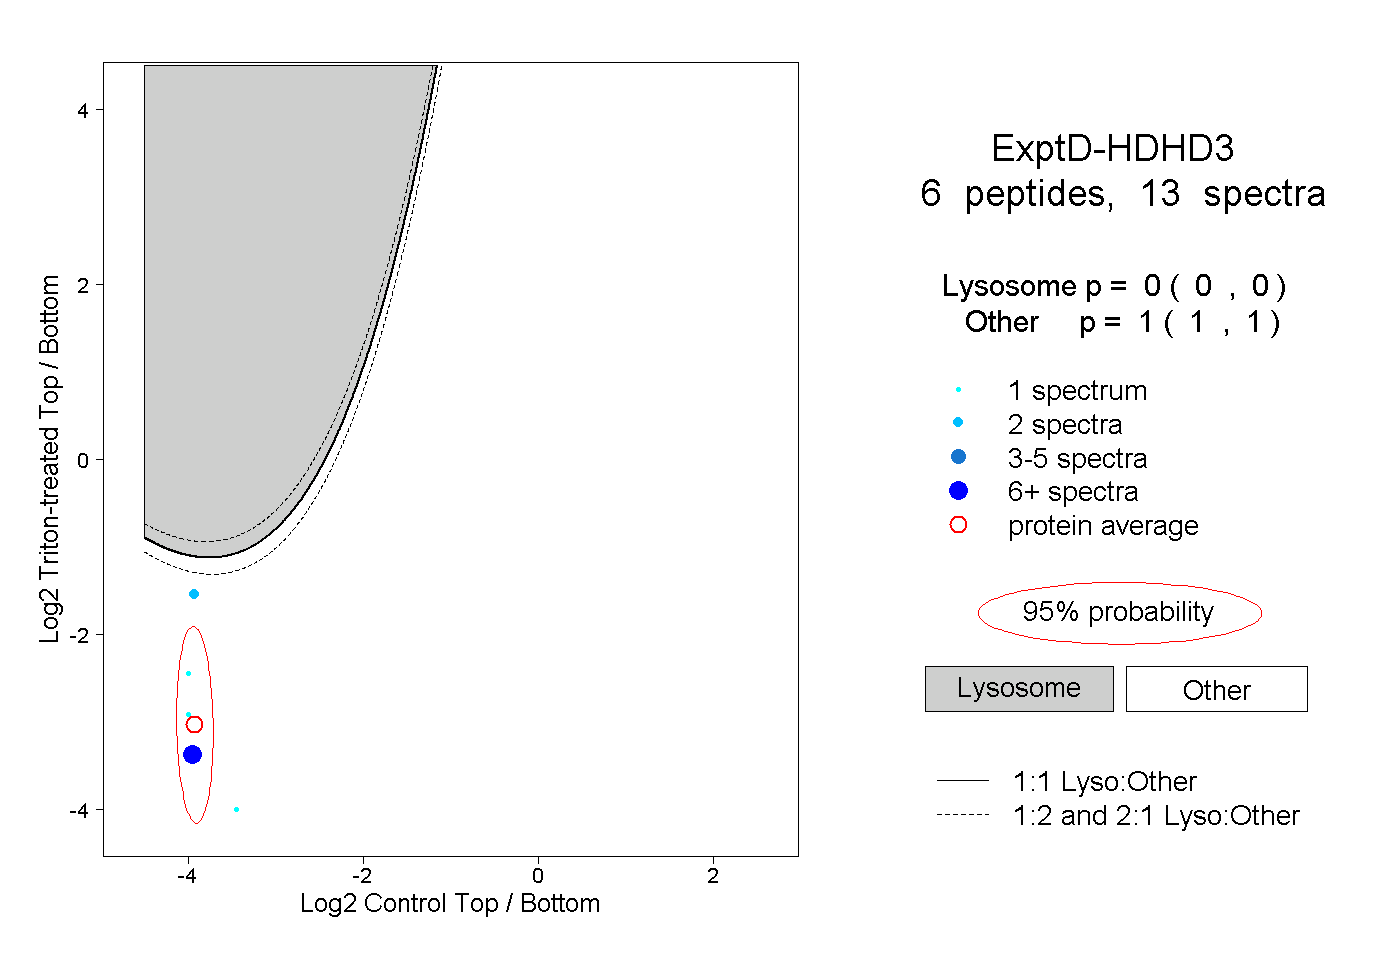
0.000 | 0.000
1.000 | 1.000