 8
8peptides
spectra
0.000 | 0.000
0.130 | 0.184
0.028 | 0.079
0.000 | 0.068
0.000 | 0.000
0.336 | 0.404
0.356 | 0.388
0.000 | 0.000
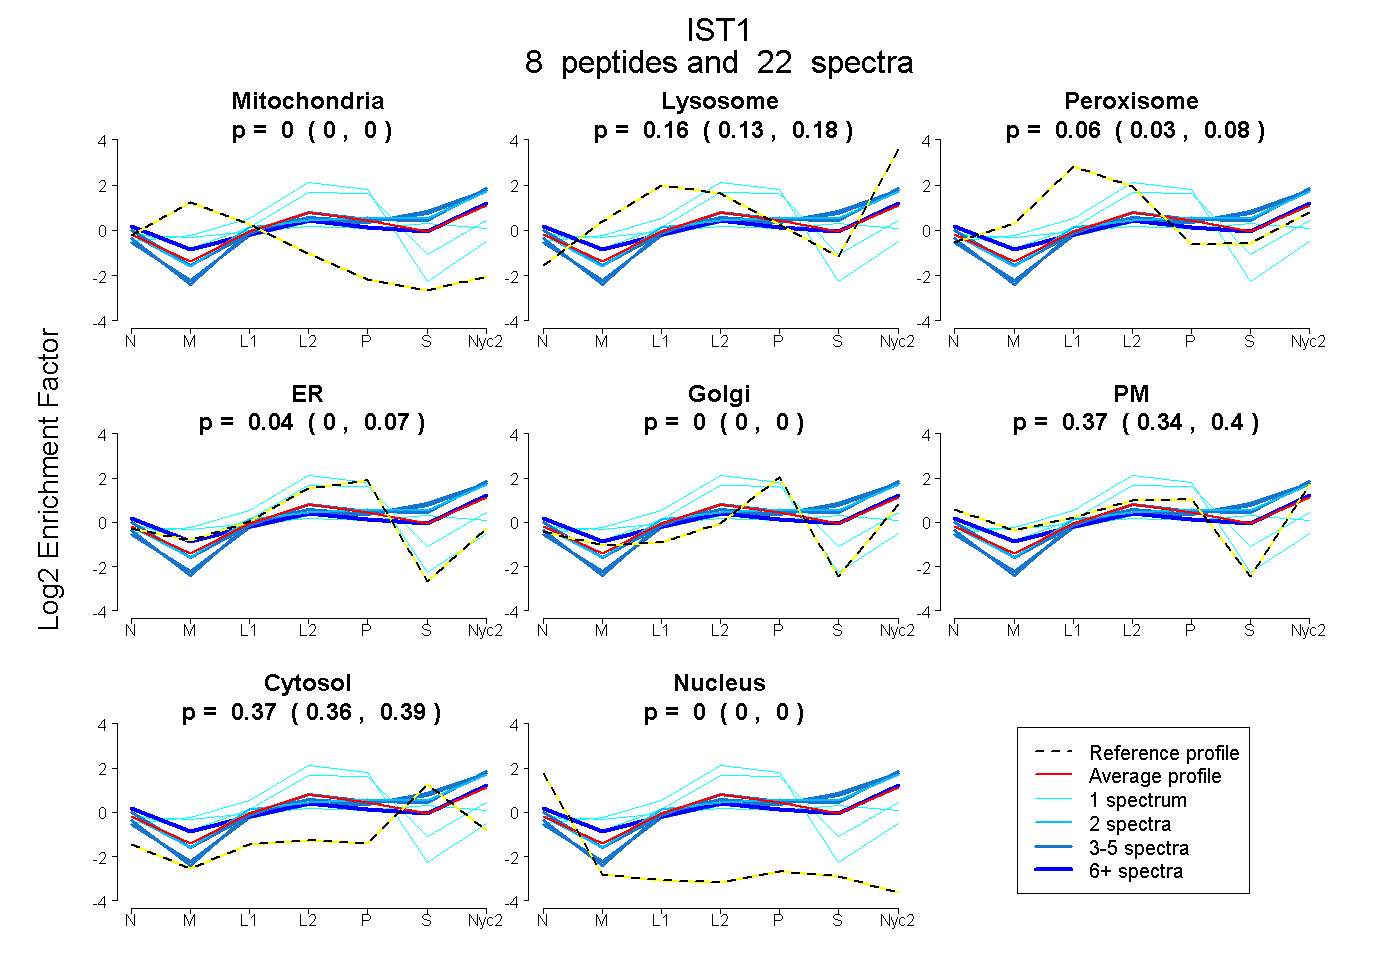
| Plot | Mito | Lyso | Perox | ER | Golgi | PM | Cytosol | Nucleus | |||||
| Expt A |
8 peptides |
22 spectra |
|
0.000 0.000 | 0.000 |
0.160 0.130 | 0.184 |
0.056 0.028 | 0.079 |
0.038 0.000 | 0.068 |
0.000 0.000 | 0.000 |
0.373 0.336 | 0.404 |
0.373 0.356 | 0.388 |
0.000 0.000 | 0.000 |
| 2 spectra, YLIEIAK | 0.000 | 0.307 | 0.000 | 0.000 | 0.000 | 0.277 | 0.416 | 0.000 | ||
| 4 spectra, VEHIIR | 0.000 | 0.315 | 0.000 | 0.000 | 0.000 | 0.195 | 0.490 | 0.000 | ||
| 3 spectra, FGLIQSMK | 0.000 | 0.320 | 0.000 | 0.000 | 0.002 | 0.163 | 0.515 | 0.000 | ||
| 1 spectrum, LGSGFK | 0.000 | 0.094 | 0.078 | 0.607 | 0.000 | 0.109 | 0.112 | 0.000 | ||
| 1 spectrum, IGGSFK | 0.000 | 0.000 | 0.144 | 0.856 | 0.000 | 0.000 | 0.000 | 0.000 | ||
| 4 spectra, TNQIGTVNDR | 0.000 | 0.281 | 0.000 | 0.000 | 0.000 | 0.335 | 0.384 | 0.000 | ||
| 6 spectra, LQSEVAELK | 0.000 | 0.110 | 0.068 | 0.000 | 0.000 | 0.453 | 0.369 | 0.000 | ||
| 1 spectrum, IVADQLCAK | 0.018 | 0.000 | 0.297 | 0.000 | 0.092 | 0.193 | 0.401 | 0.000 |
| Plot | Lyso | Other | |||||||||||
| Expt C |
10 peptides |
38 spectra |
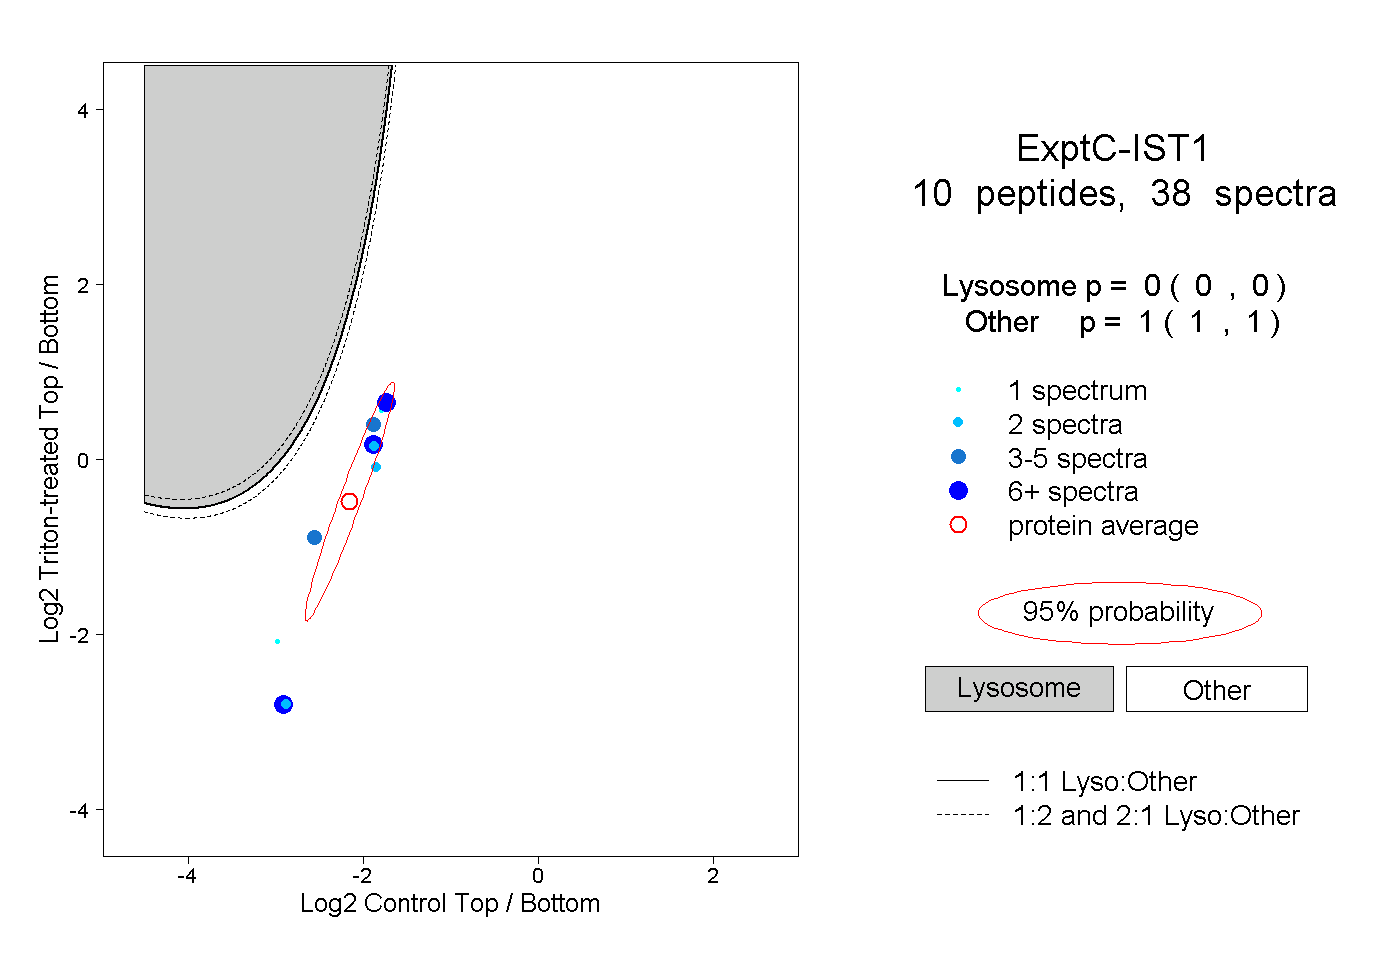 |
0.000 0.000 | 0.000 |
1.000 1.000 | 1.000 |
||||||||
| Plot | Lyso | Other | |||||||||||
| Expt D |
2 peptides |
4 spectra |
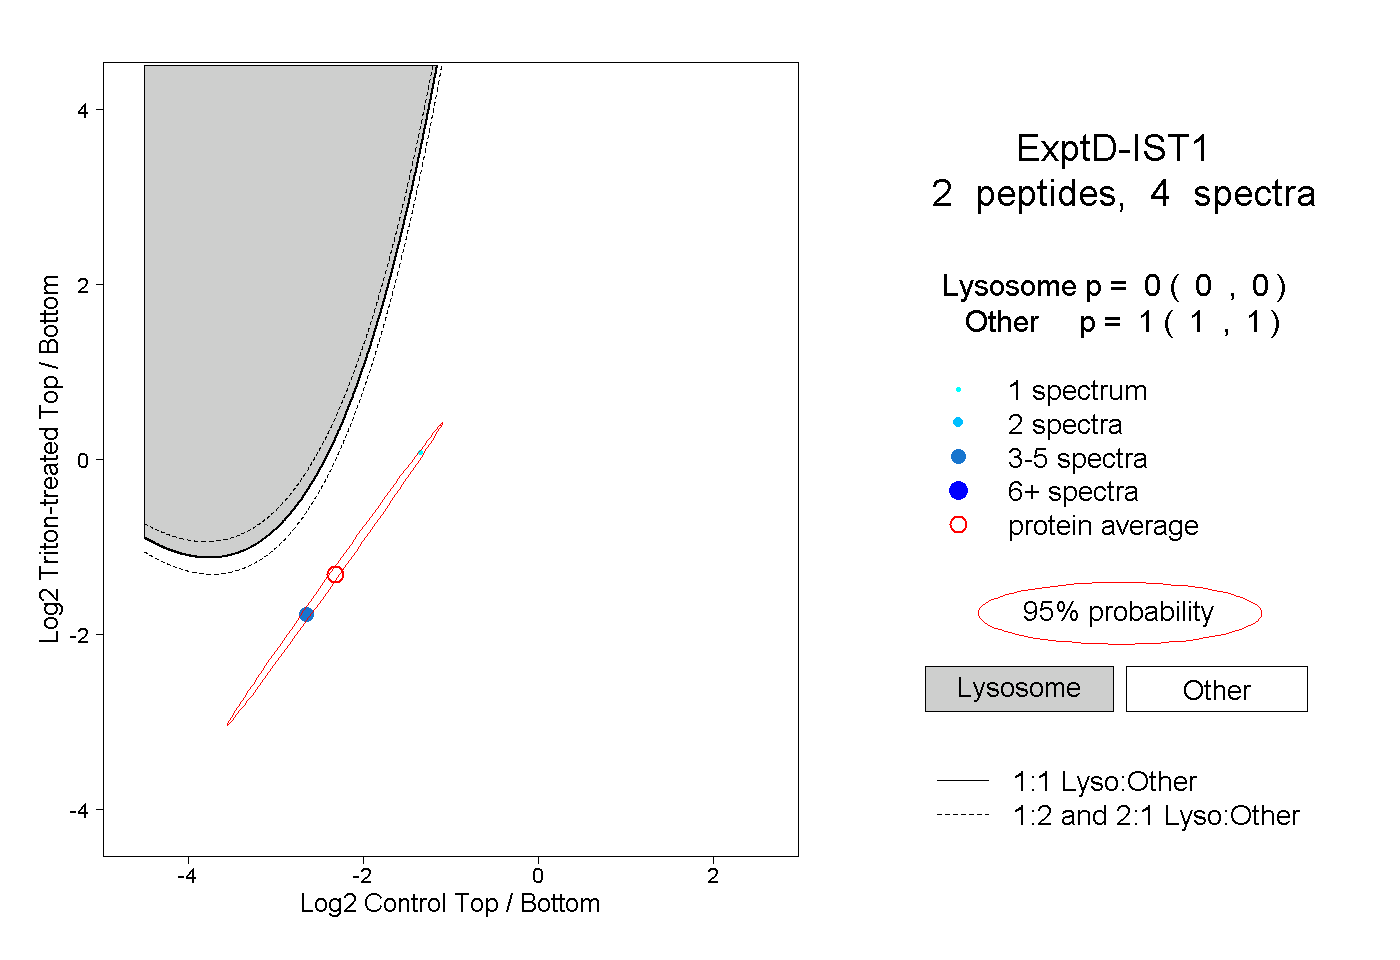 |
0.000 0.000 | 0.000 |
1.000 1.000 | 1.000 |