 2
2peptides
spectra
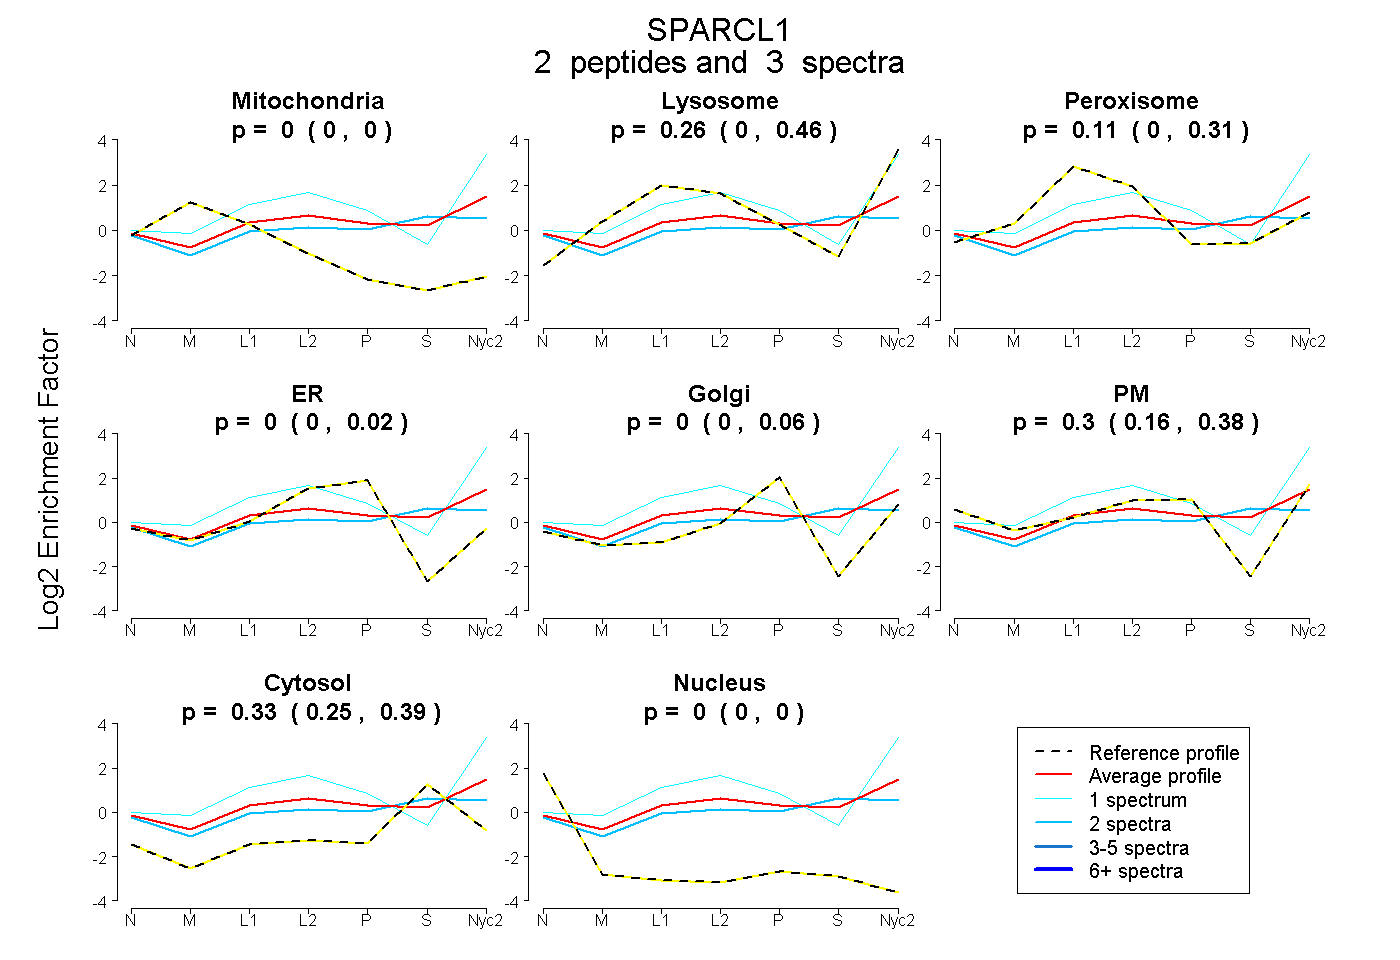
0.000 | 0.000
0.000 | 0.463
0.000 | 0.313
0.000 | 0.016
0.000 | 0.058
0.161 | 0.379
0.254 | 0.394
0.000 | 0.000
| Plot | Mito | Lyso | Perox | ER | Golgi | PM | Cytosol | Nucleus | |||||
| Expt A |
2 peptides |
3 spectra |
|
0.000 0.000 | 0.000 |
0.259 0.000 | 0.463 |
0.107 0.000 | 0.313 |
0.000 0.000 | 0.016 |
0.000 0.000 | 0.058 |
0.300 0.161 | 0.379 |
0.334 0.254 | 0.394 |
0.000 0.000 | 0.000 |
| 2 spectra, EHLPHTEWQGQEGR | 0.000 | 0.050 | 0.190 | 0.000 | 0.000 | 0.271 | 0.489 | 0.000 | ||
| 1 spectrum, ILTHSELAPLR | 0.000 | 0.637 | 0.000 | 0.000 | 0.000 | 0.350 | 0.013 | 0.000 |
| Plot | Lyso | Other | |||||||||||
| Expt C |
6 peptides |
14 spectra |
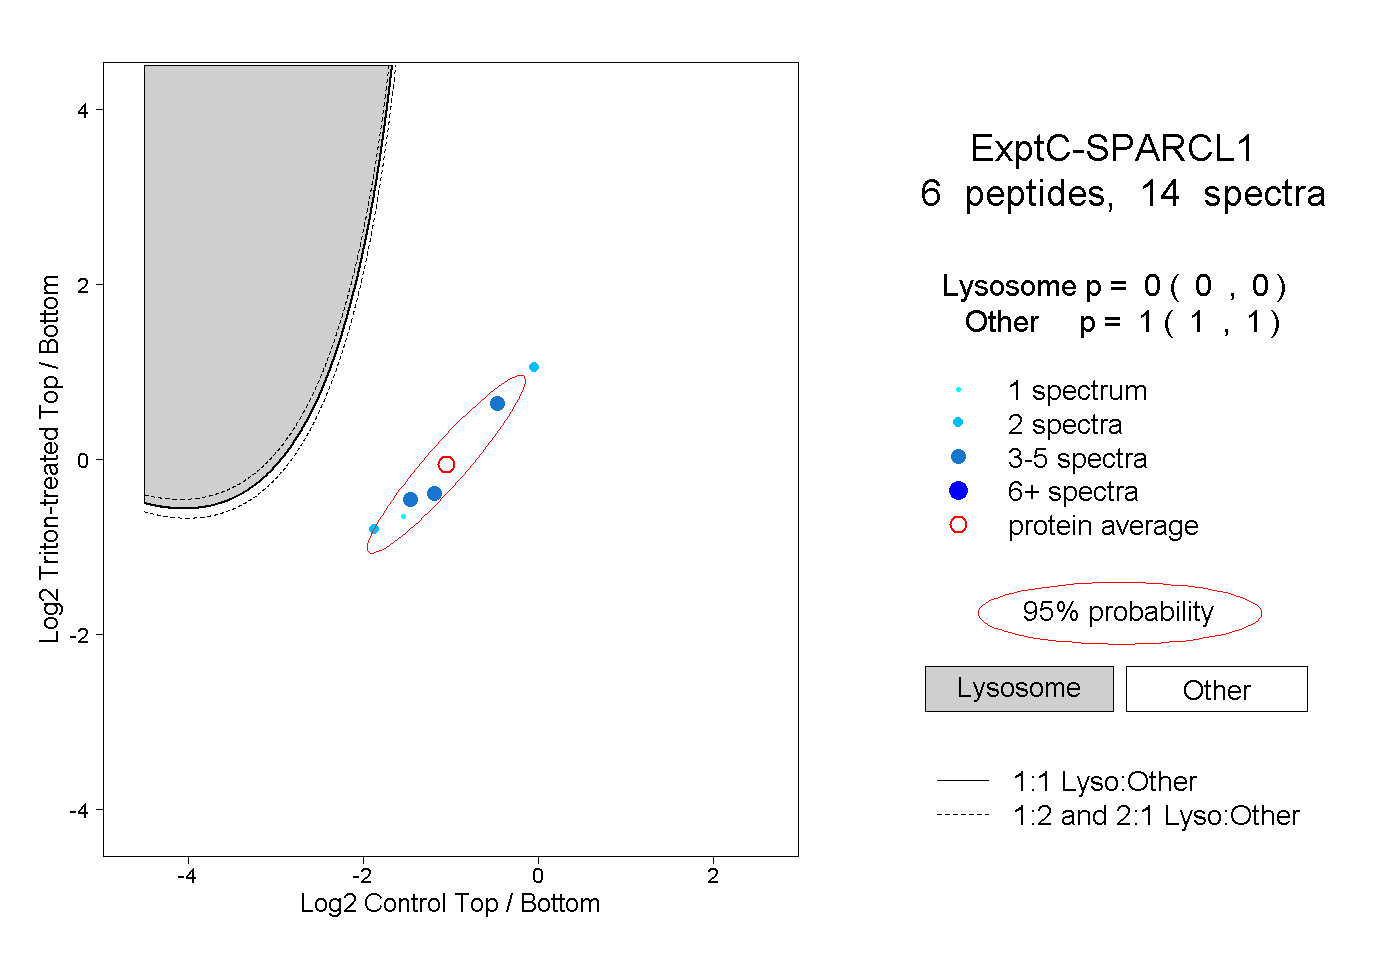 |
0.000 0.000 | 0.000 |
1.000 1.000 | 1.000 |