 2
2peptides
spectra
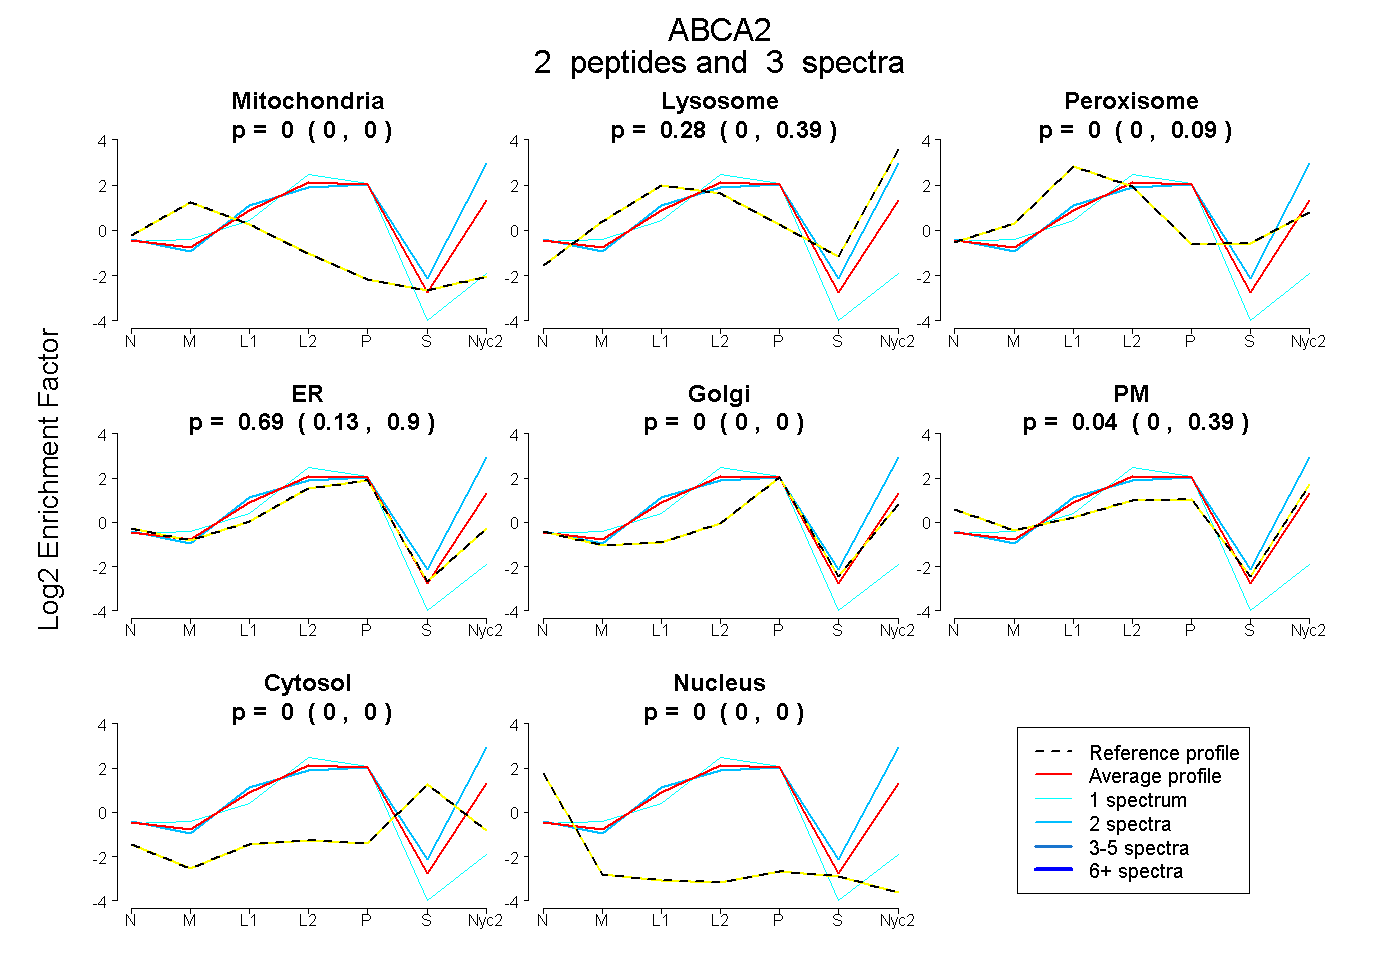
0.000 | 0.000
0.000 | 0.393
0.000 | 0.089
0.134 | 0.903
0.000 | 0.000
0.000 | 0.391
0.000 | 0.000
0.000 | 0.000
8peptides
spectra
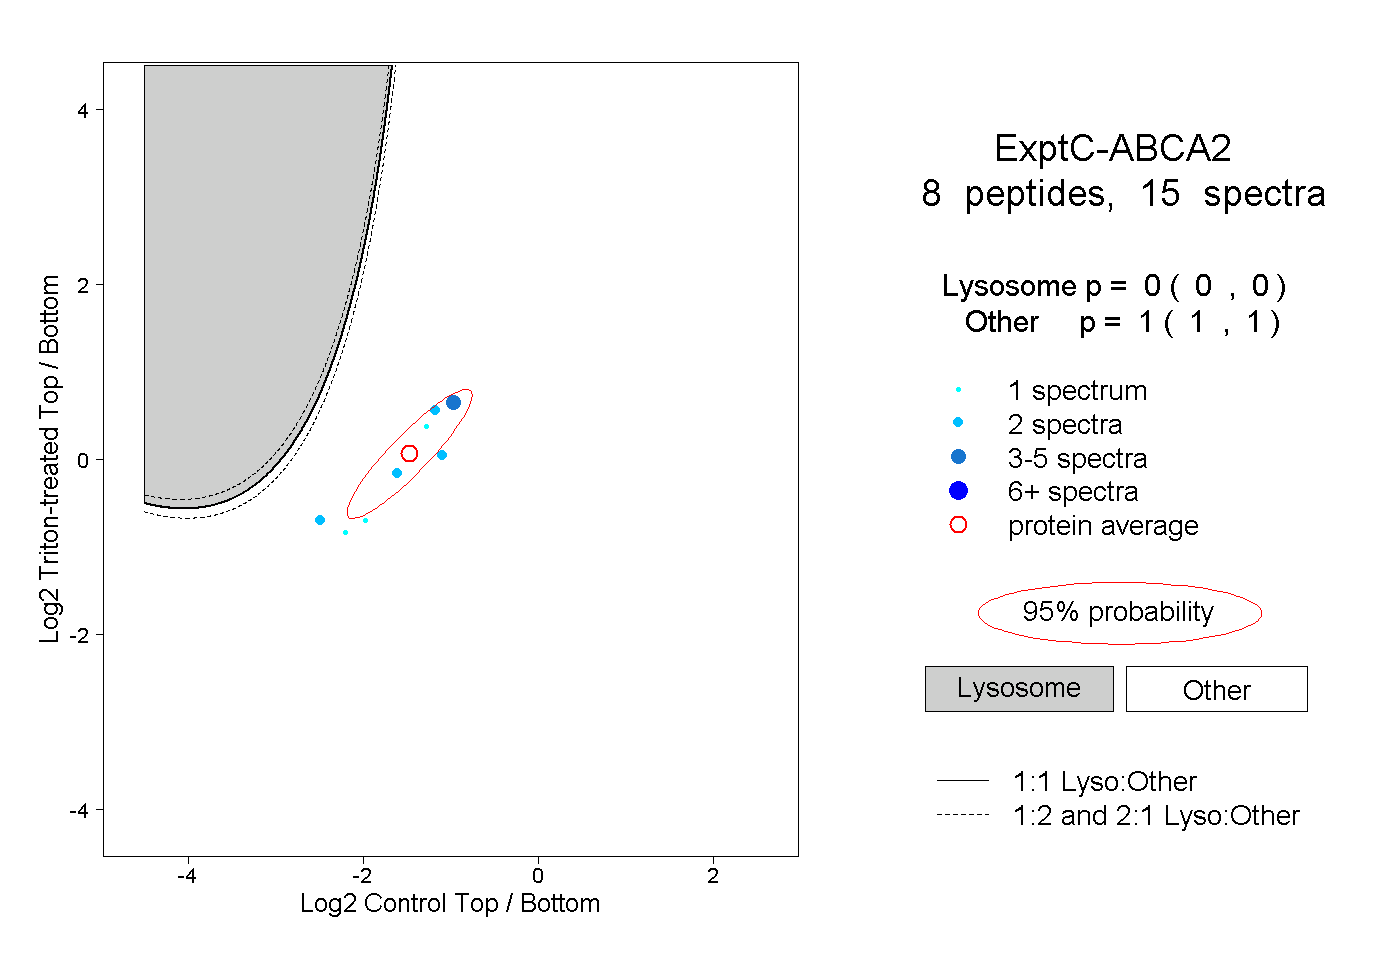
0.000 | 0.000
1.000 | 1.000
2peptides
spectra
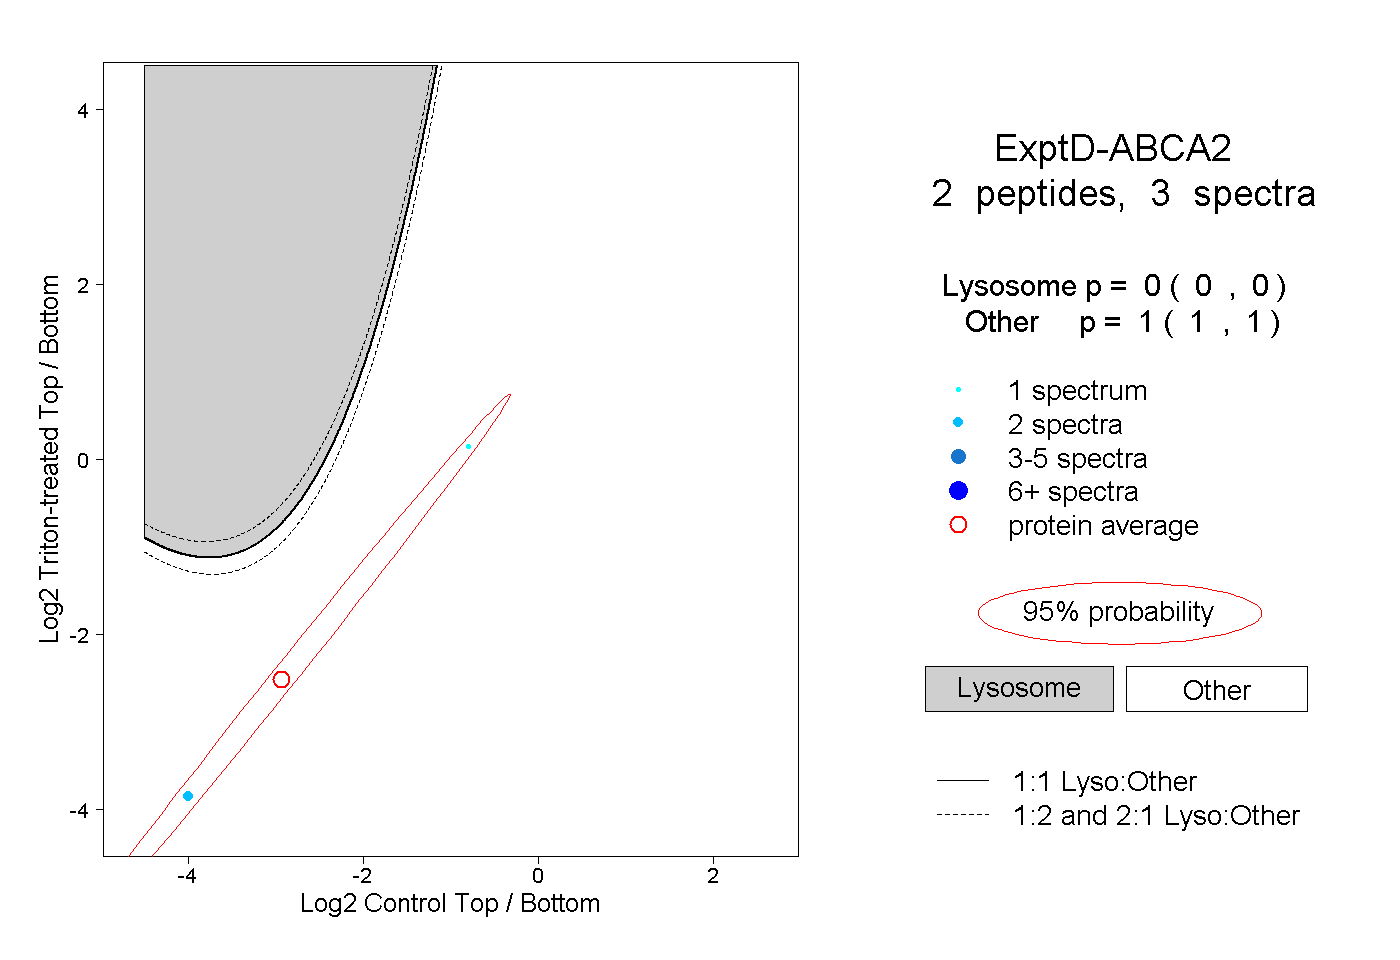
0.000 | 0.000
1.000 | 1.000