 21
21peptides
spectra
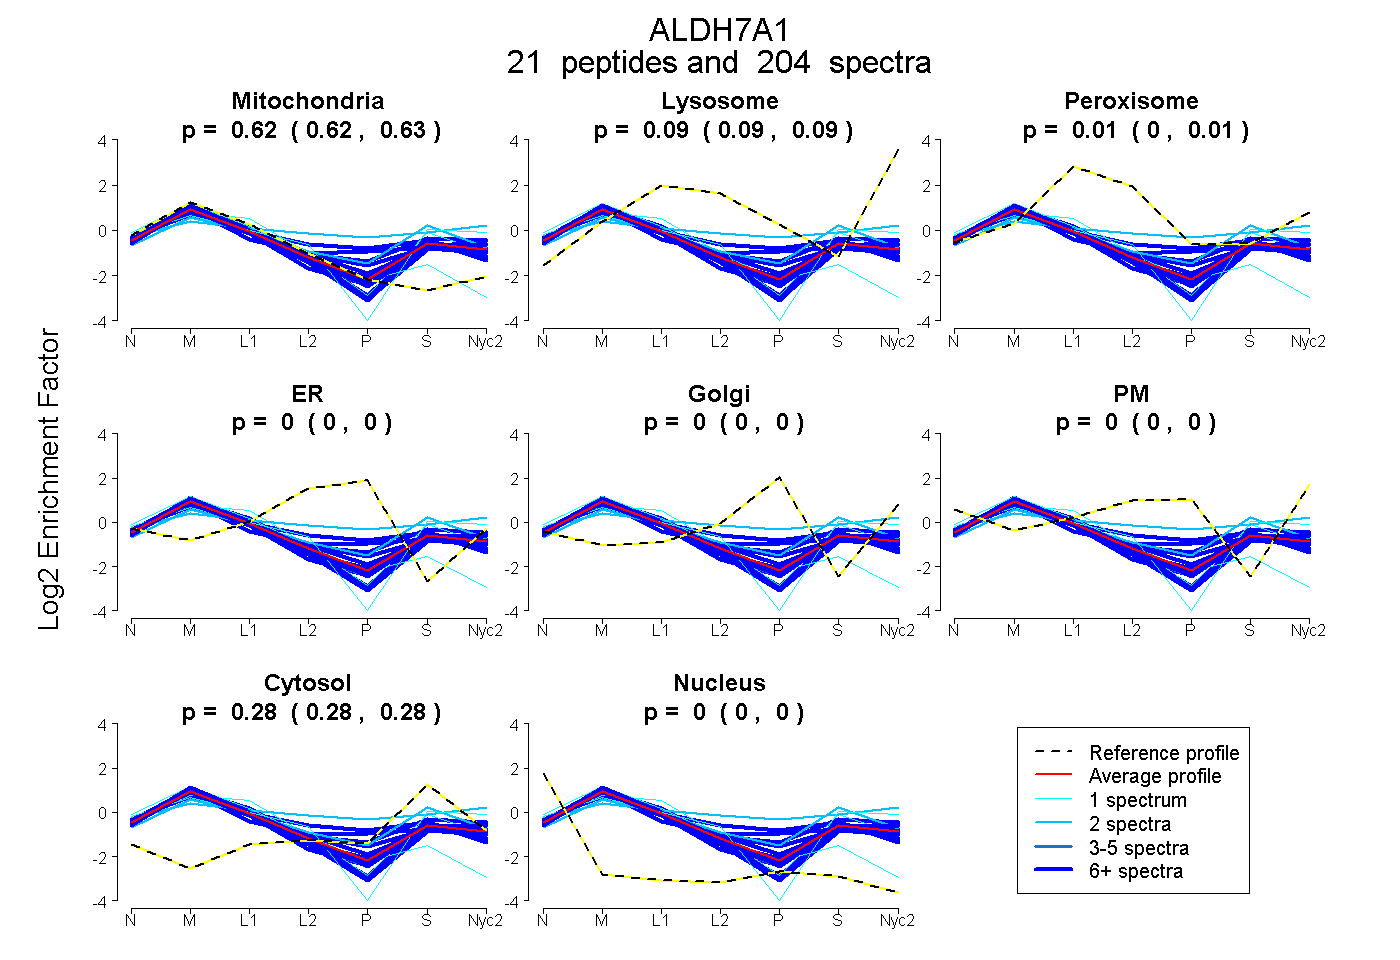
0.623 | 0.627
0.088 | 0.093
0.003 | 0.009
0.000 | 0.000
0.000 | 0.000
0.000 | 0.000
0.277 | 0.279
0.000 | 0.000
17peptides
spectra
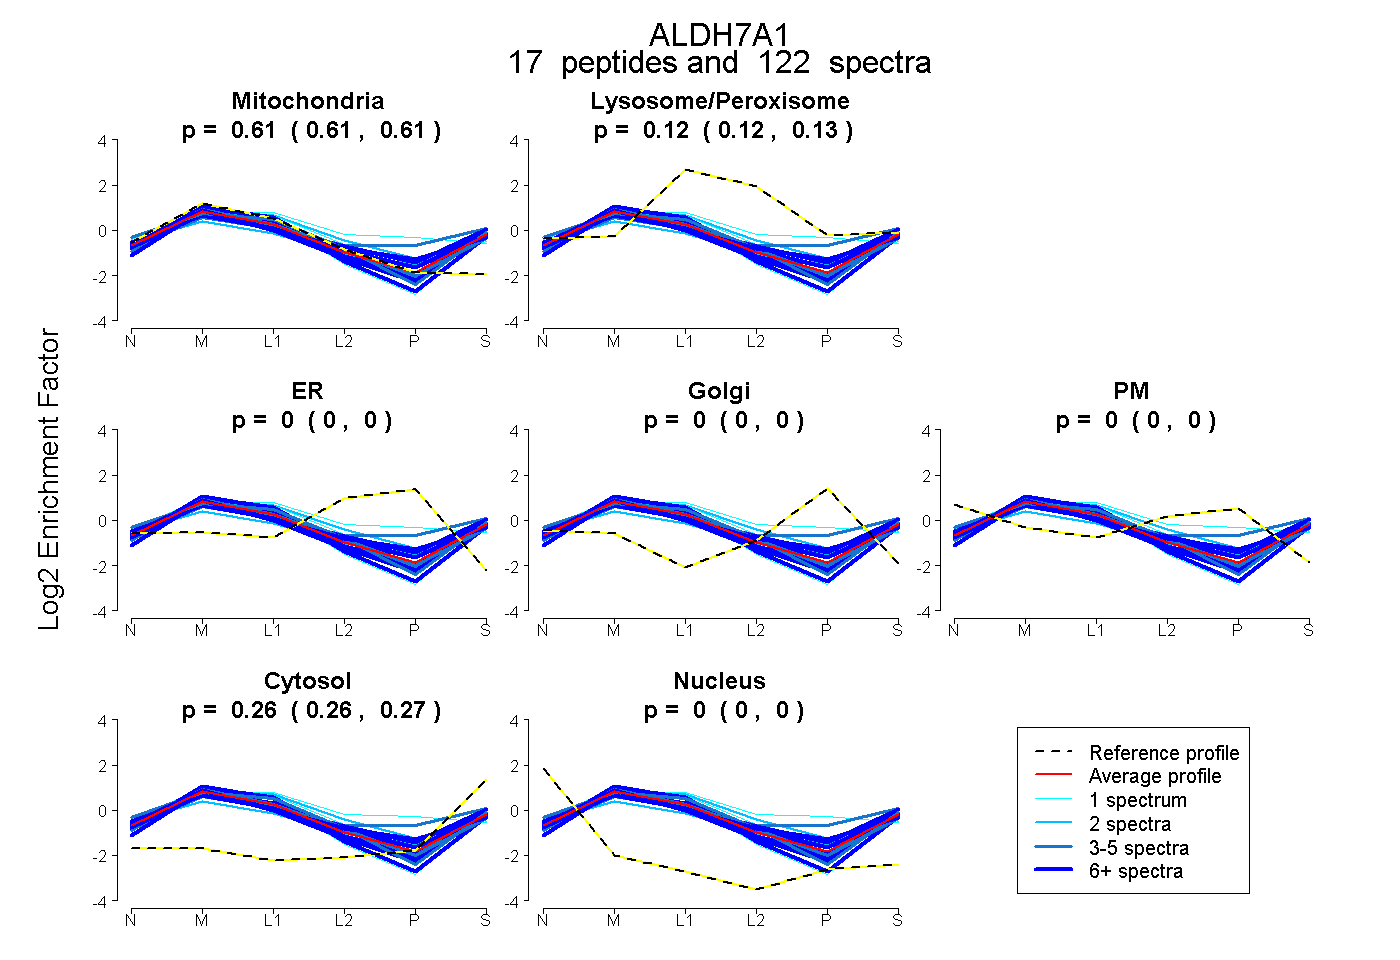
0.609 | 0.614
0.122 | 0.127
0.000 | 0.000
0.000 | 0.000
0.000 | 0.000
0.262 | 0.265
0.000 | 0.000
22peptides
spectra
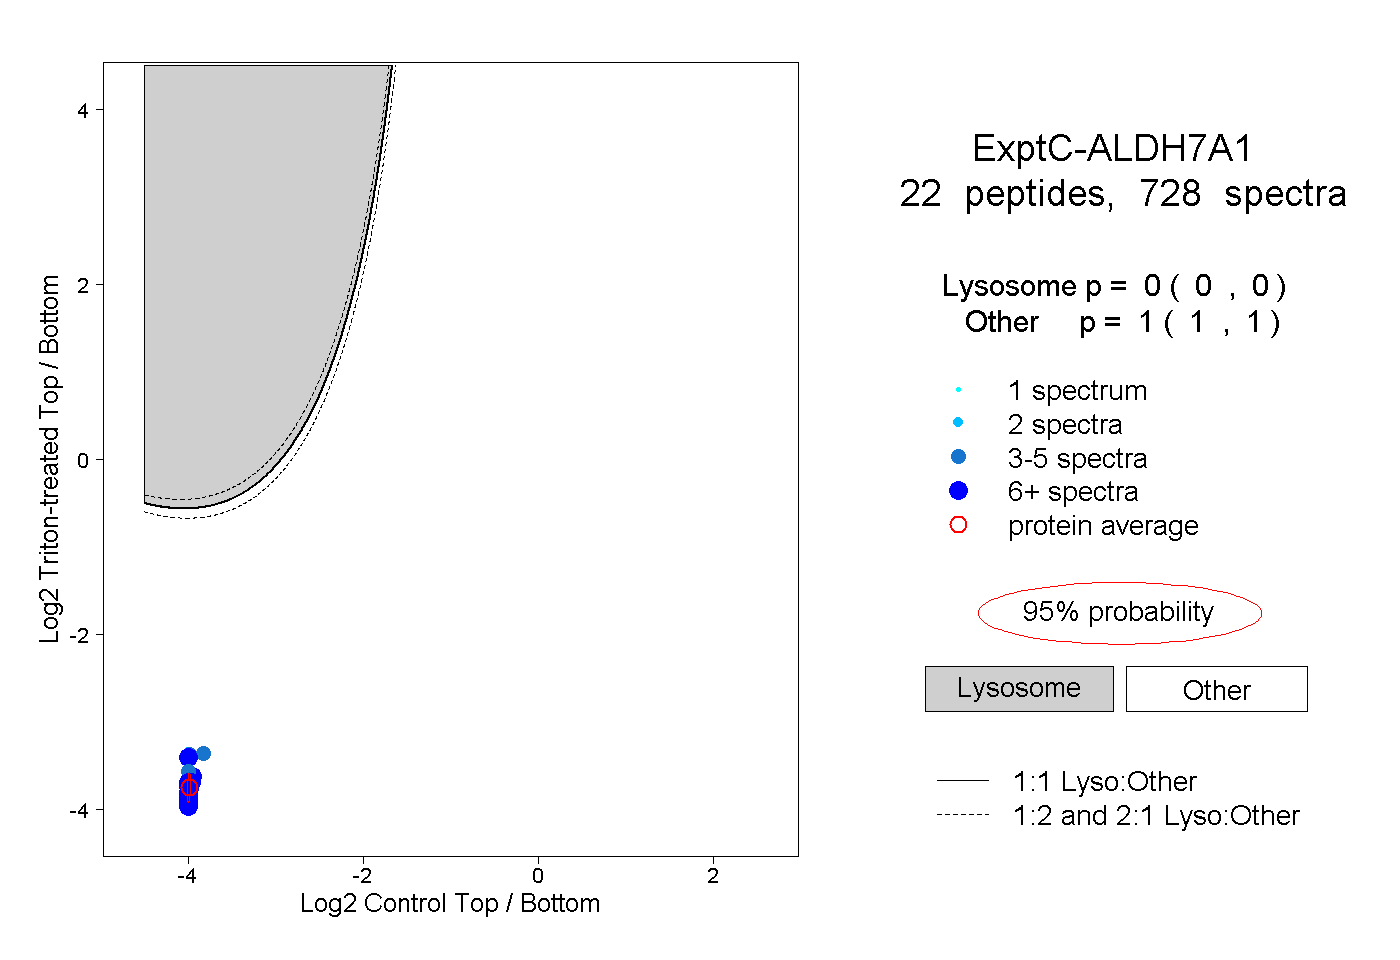
0.000 | 0.000
1.000 | 1.000
7peptides
spectra
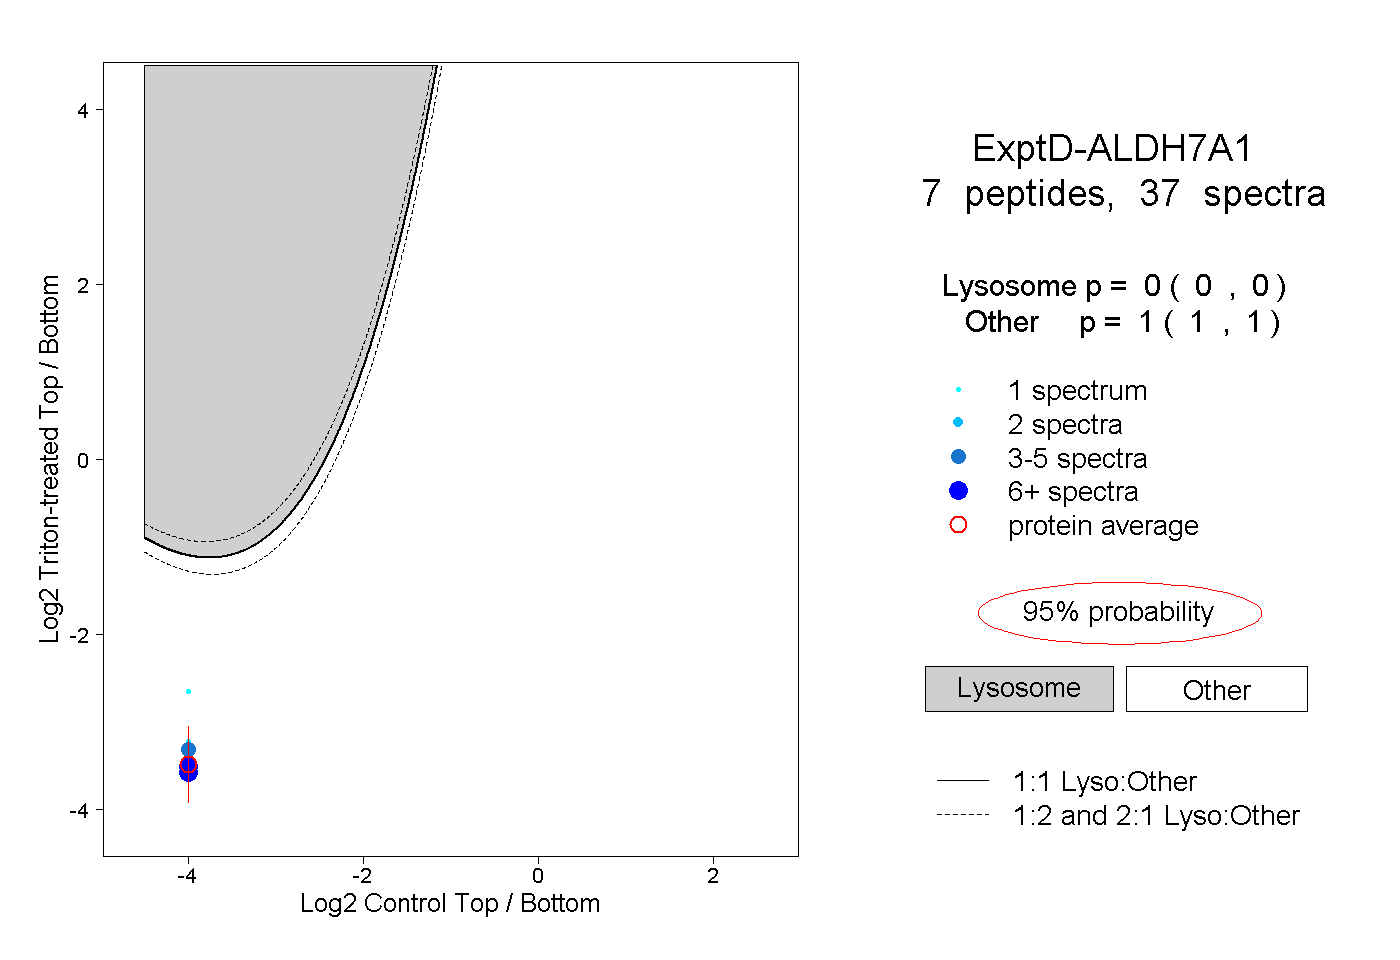
0.000 | 0.000
1.000 | 1.000