 21
21peptides
spectra
0.623 | 0.627
0.088 | 0.093
0.003 | 0.009
0.000 | 0.000
0.000 | 0.000
0.000 | 0.000
0.277 | 0.279
0.000 | 0.000
| Plot | Mito | Lyso | Perox | ER | Golgi | PM | Cytosol | Nucleus | |||||
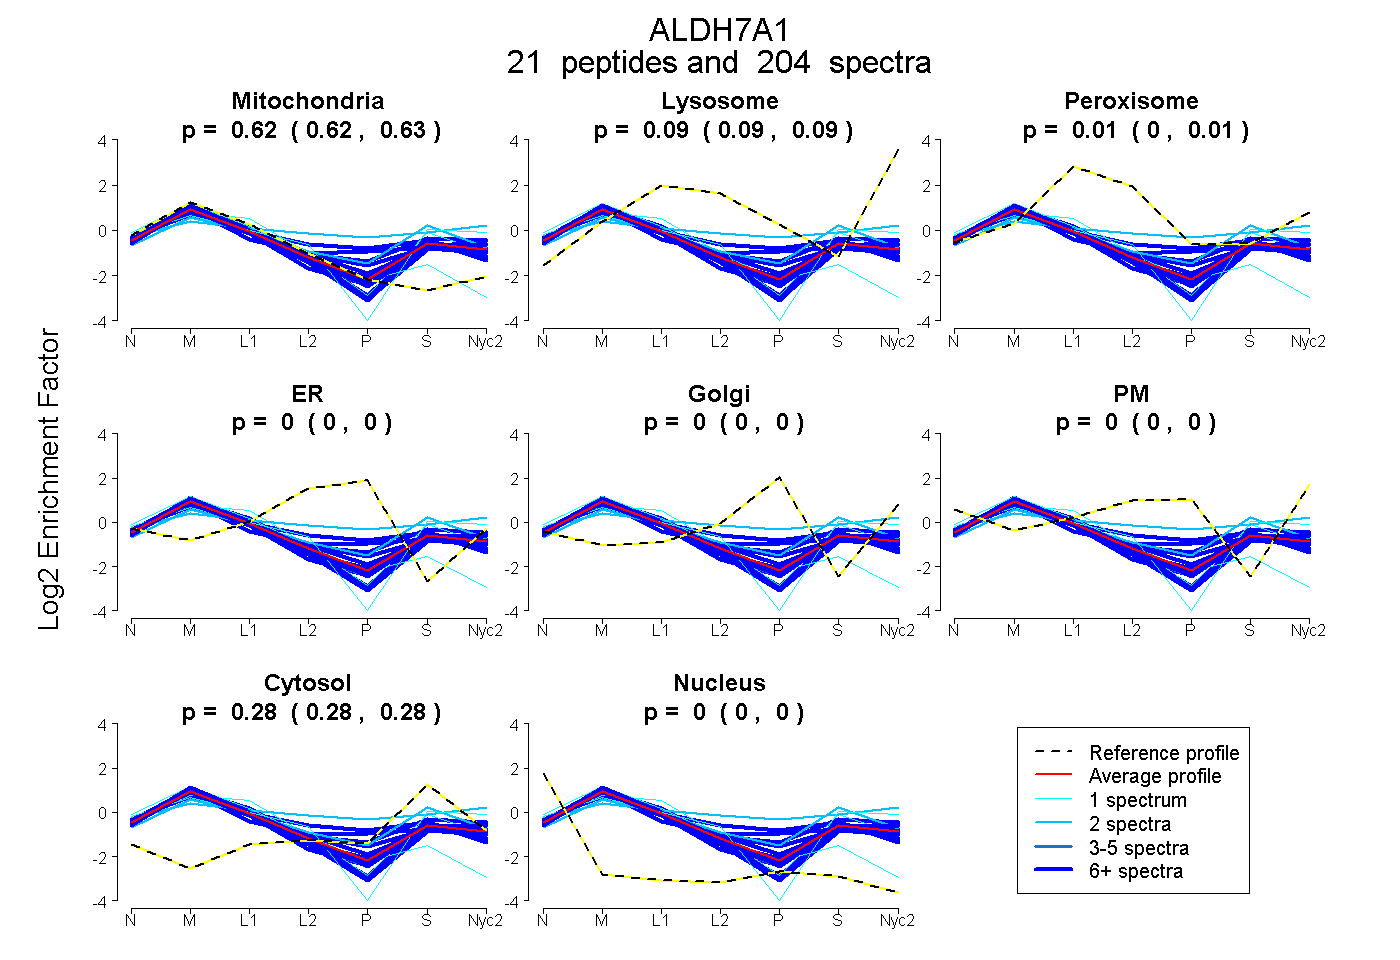
| Expt A |
21 peptides |
204 spectra |
|
0.625 0.623 | 0.627 |
0.091 0.088 | 0.093 |
0.006 0.003 | 0.009 |
0.000 0.000 | 0.000 |
0.000 0.000 | 0.000 |
0.000 0.000 | 0.000 |
0.278 0.277 | 0.279 |
0.000 0.000 | 0.000 |
| 11 spectra, LVSLEMGK | 0.715 | 0.041 | 0.000 | 0.000 | 0.000 | 0.000 | 0.244 | 0.000 | ||
| 46 spectra, NAYSQIR | 0.671 | 0.073 | 0.000 | 0.000 | 0.000 | 0.000 | 0.256 | 0.000 | ||
| 13 spectra, GAPTTSLVSIAVTK | 0.657 | 0.000 | 0.088 | 0.000 | 0.000 | 0.000 | 0.254 | 0.000 | ||
| 7 spectra, EGGTVVYGGK | 0.501 | 0.174 | 0.000 | 0.000 | 0.000 | 0.000 | 0.324 | 0.000 | ||
| 12 spectra, EDNEGVFNGSWGGR | 0.658 | 0.096 | 0.005 | 0.000 | 0.000 | 0.000 | 0.242 | 0.000 | ||
| 6 spectra, VGNPWDPNILYGPLHTK | 0.632 | 0.121 | 0.000 | 0.000 | 0.000 | 0.000 | 0.247 | 0.000 | ||
| 24 spectra, ETFAPILYVFK | 0.719 | 0.000 | 0.033 | 0.000 | 0.000 | 0.000 | 0.249 | 0.000 | ||
| 7 spectra, QAVSMFVQAVEEAK | 0.516 | 0.156 | 0.000 | 0.000 | 0.076 | 0.000 | 0.251 | 0.000 | ||
| 4 spectra, IQLLGR | 0.637 | 0.090 | 0.000 | 0.000 | 0.000 | 0.000 | 0.273 | 0.000 | ||
| 2 spectra, LFLHESIHDEVVDR | 0.202 | 0.115 | 0.172 | 0.000 | 0.000 | 0.196 | 0.315 | 0.000 | ||
| 8 spectra, VNLLSFTGSTQVGK | 0.628 | 0.062 | 0.000 | 0.000 | 0.000 | 0.000 | 0.309 | 0.000 | ||
| 9 spectra, ESGSDAWK | 0.485 | 0.000 | 0.175 | 0.000 | 0.073 | 0.000 | 0.266 | 0.000 | ||
| 1 spectrum, GSDCGIVNVNIPTSGAEIGGAFGGEK | 0.554 | 0.000 | 0.162 | 0.000 | 0.000 | 0.000 | 0.284 | 0.000 | ||
| 28 spectra, QVALMVQER | 0.634 | 0.090 | 0.000 | 0.000 | 0.000 | 0.000 | 0.276 | 0.000 | ||
| 6 spectra, DYEETIGK | 0.683 | 0.000 | 0.000 | 0.000 | 0.000 | 0.000 | 0.317 | 0.000 | ||
| 8 spectra, GEVITTYCPANNEPIAR | 0.689 | 0.045 | 0.000 | 0.000 | 0.000 | 0.000 | 0.266 | 0.000 | ||
| 7 spectra, QGLSSSIFTK | 0.573 | 0.178 | 0.000 | 0.000 | 0.000 | 0.000 | 0.249 | 0.000 | ||
| 1 spectrum, VMDHPGNYVEPTIVTGLVHDAPIVHK | 0.496 | 0.000 | 0.174 | 0.000 | 0.000 | 0.000 | 0.330 | 0.000 | ||
| 2 spectra, STCTINYSTALPLAQGIK | 0.408 | 0.053 | 0.138 | 0.000 | 0.000 | 0.000 | 0.400 | 0.000 | ||
| 1 spectrum, AWNIWADIPAPK | 0.658 | 0.105 | 0.006 | 0.000 | 0.000 | 0.000 | 0.231 | 0.000 | ||
| 1 spectrum, NEEEVFEWNNEVK | 0.887 | 0.000 | 0.000 | 0.000 | 0.000 | 0.000 | 0.092 | 0.021 |
| Plot | Mito | Lyso or Perox | ER | Golgi | PM | Cytosol | Nucleus | ||||||
| Expt B |
17 peptides |
122 spectra |
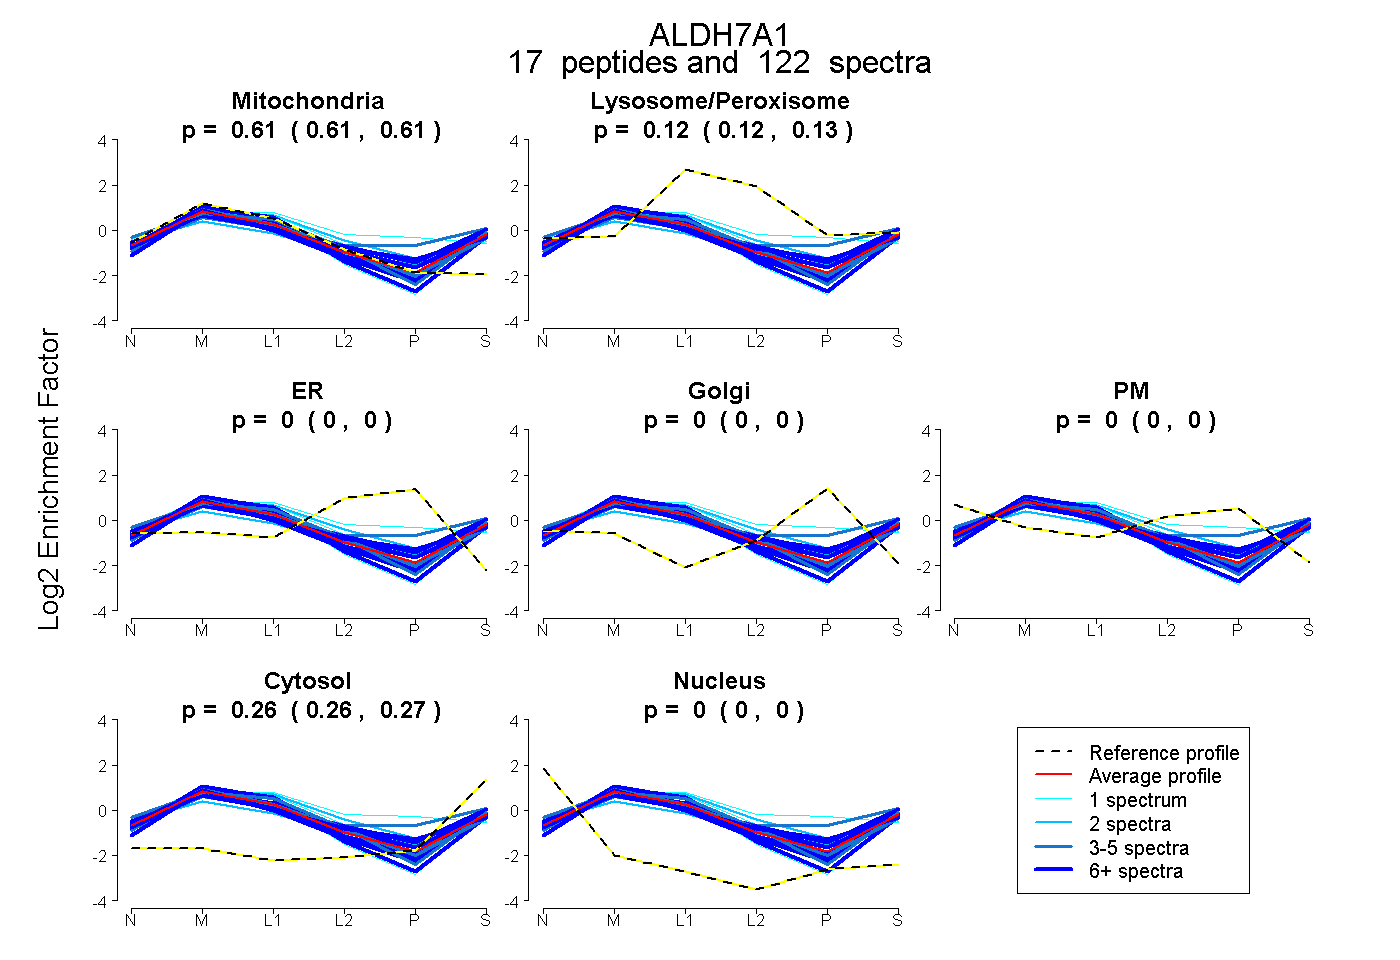 |
0.611 0.609 | 0.614 |
0.125 0.122 | 0.127 |
0.000 0.000 | 0.000 |
0.000 0.000 | 0.000 |
0.000 0.000 | 0.000 |
0.264 0.262 | 0.265 |
0.000 0.000 | 0.000 |
|||
| Plot | Lyso | Other | |||||||||||
| Expt C |
22 peptides |
728 spectra |
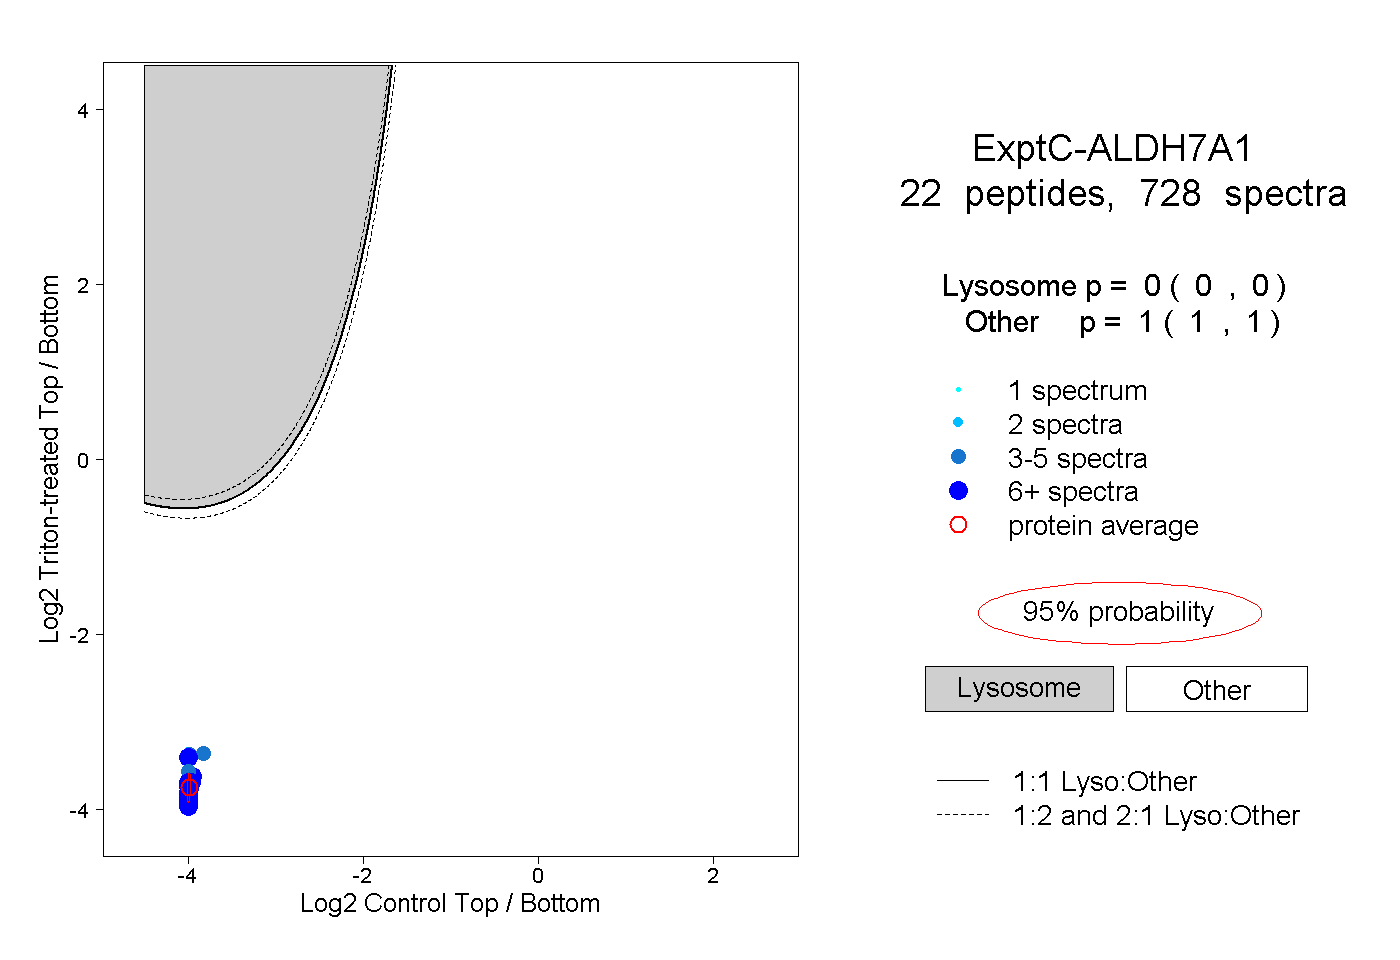 |
0.000 0.000 | 0.000 |
1.000 1.000 | 1.000 |
||||||||
| Plot | Lyso | Other | |||||||||||
| Expt D |
7 peptides |
37 spectra |
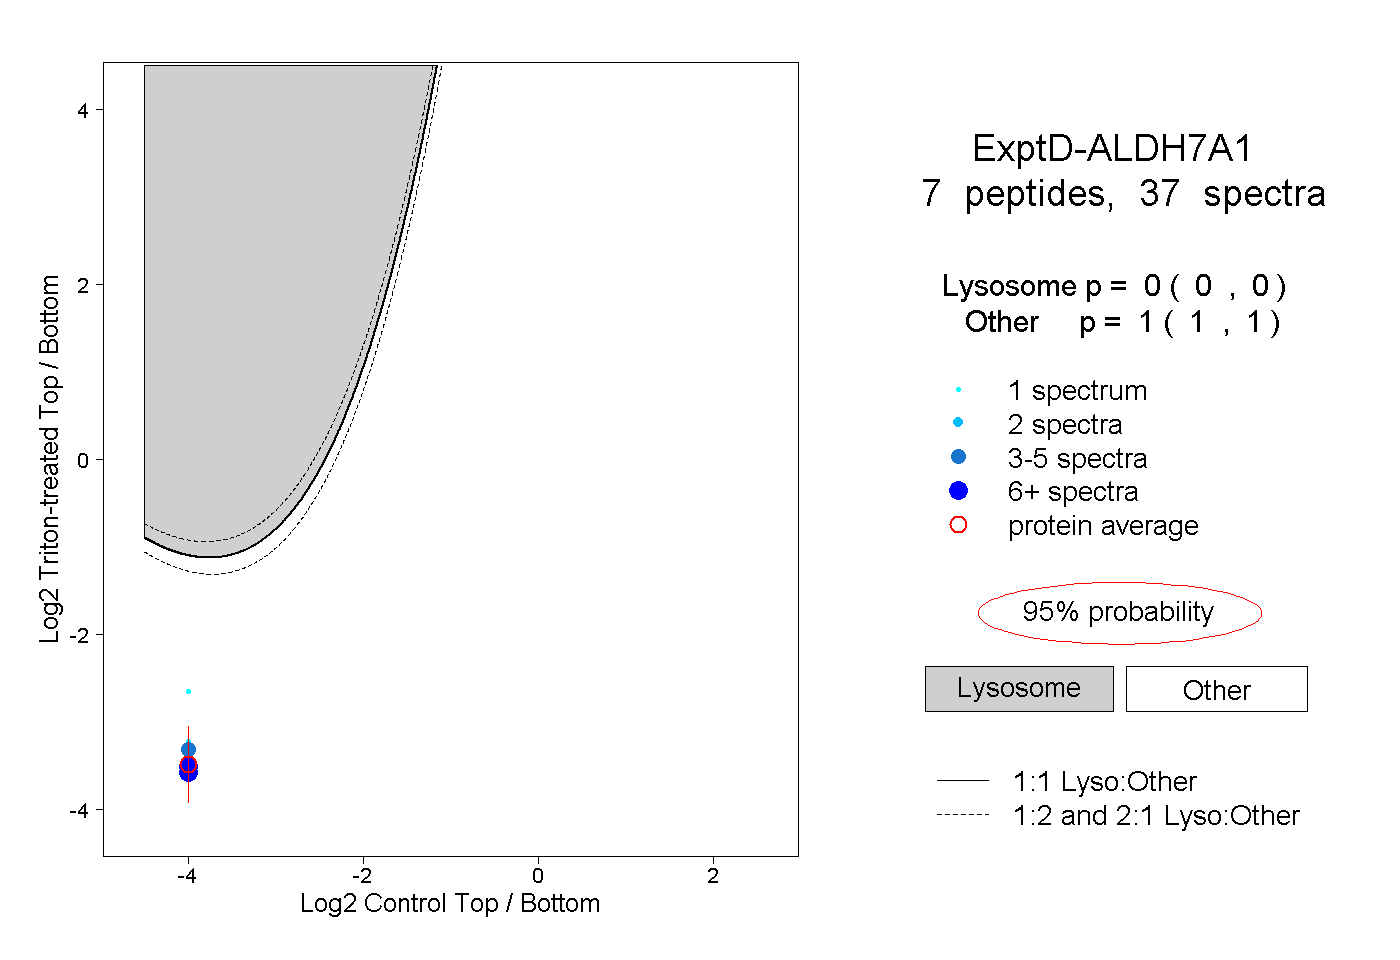 |
0.000 0.000 | 0.000 |
1.000 1.000 | 1.000 |