 42
42peptides
spectra
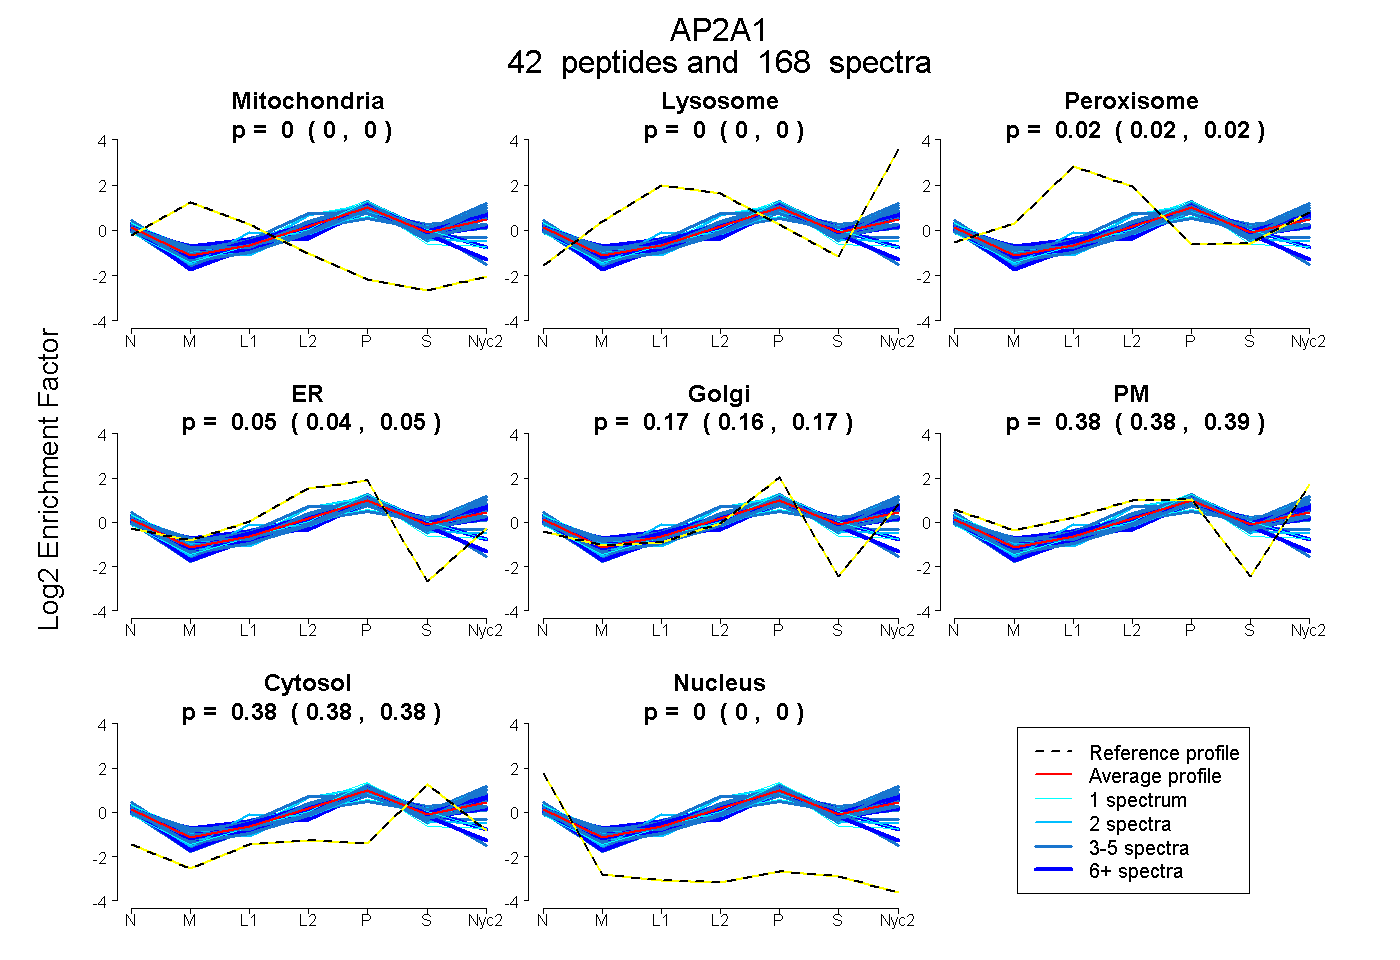
0.000 | 0.000
0.000 | 0.000
0.018 | 0.021
0.041 | 0.054
0.163 | 0.173
0.380 | 0.388
0.378 | 0.381
0.000 | 0.000
4peptides
spectra
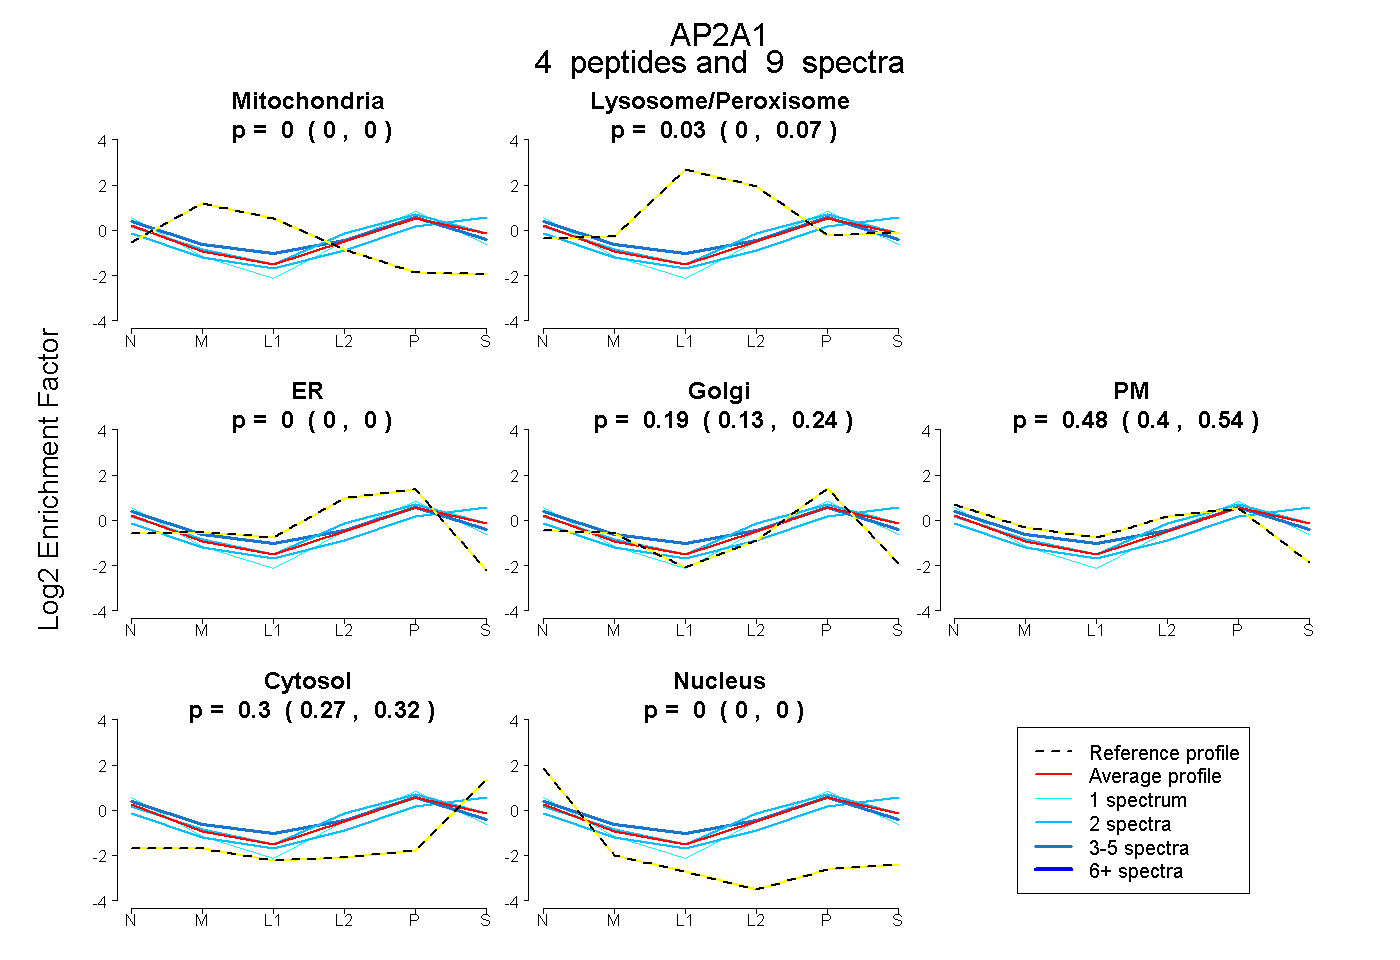
0.000 | 0.000
0.000 | 0.065
0.000 | 0.000
0.128 | 0.239
0.401 | 0.544
0.273 | 0.319
0.000 | 0.000
23peptides
spectra
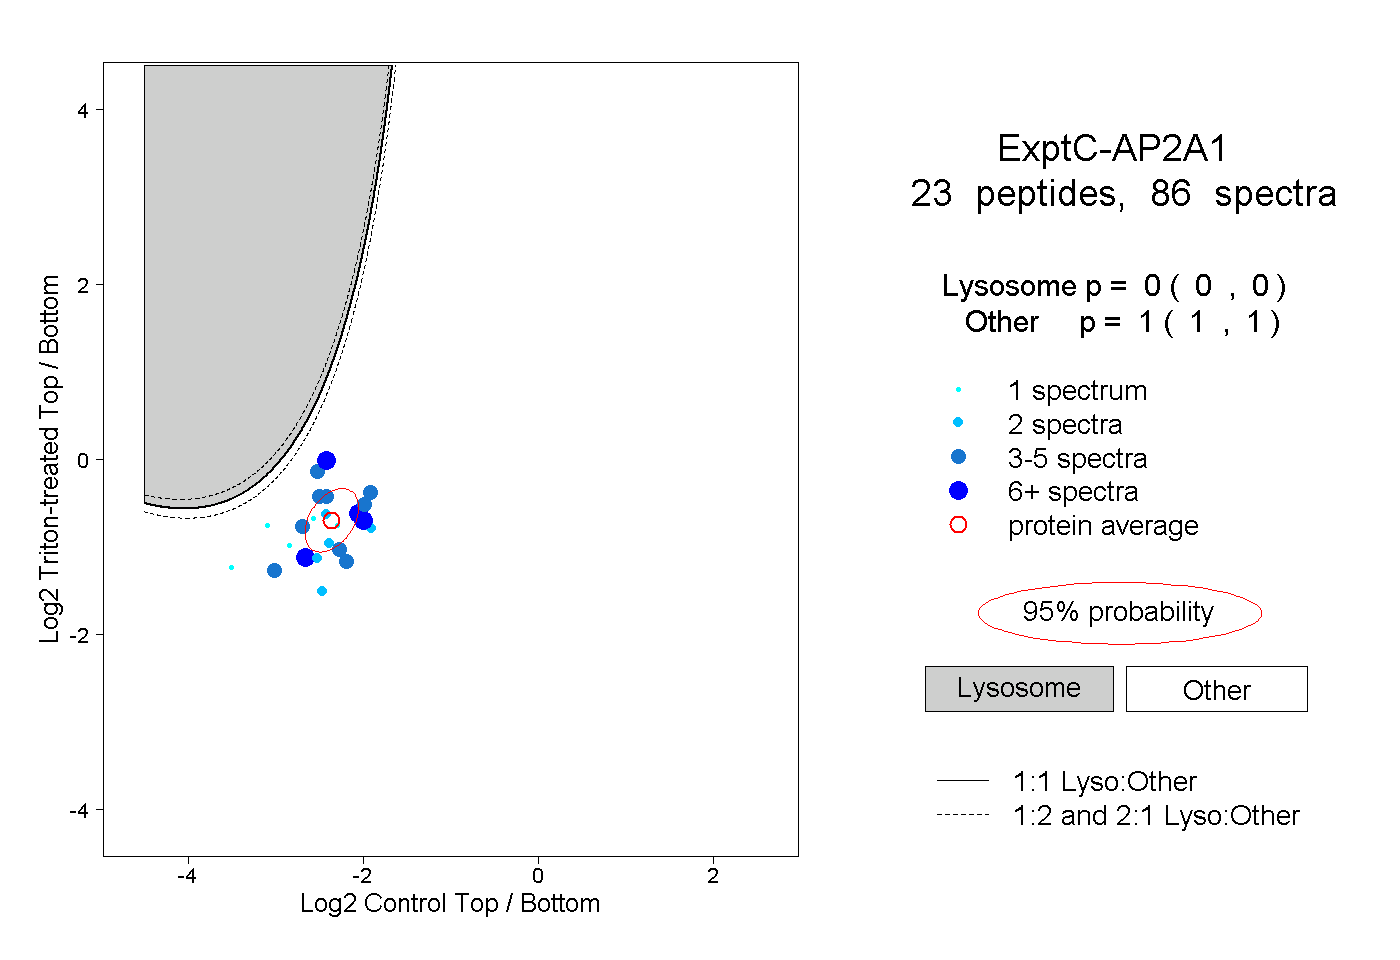
0.000 | 0.000
1.000 | 1.000
5peptides
spectra
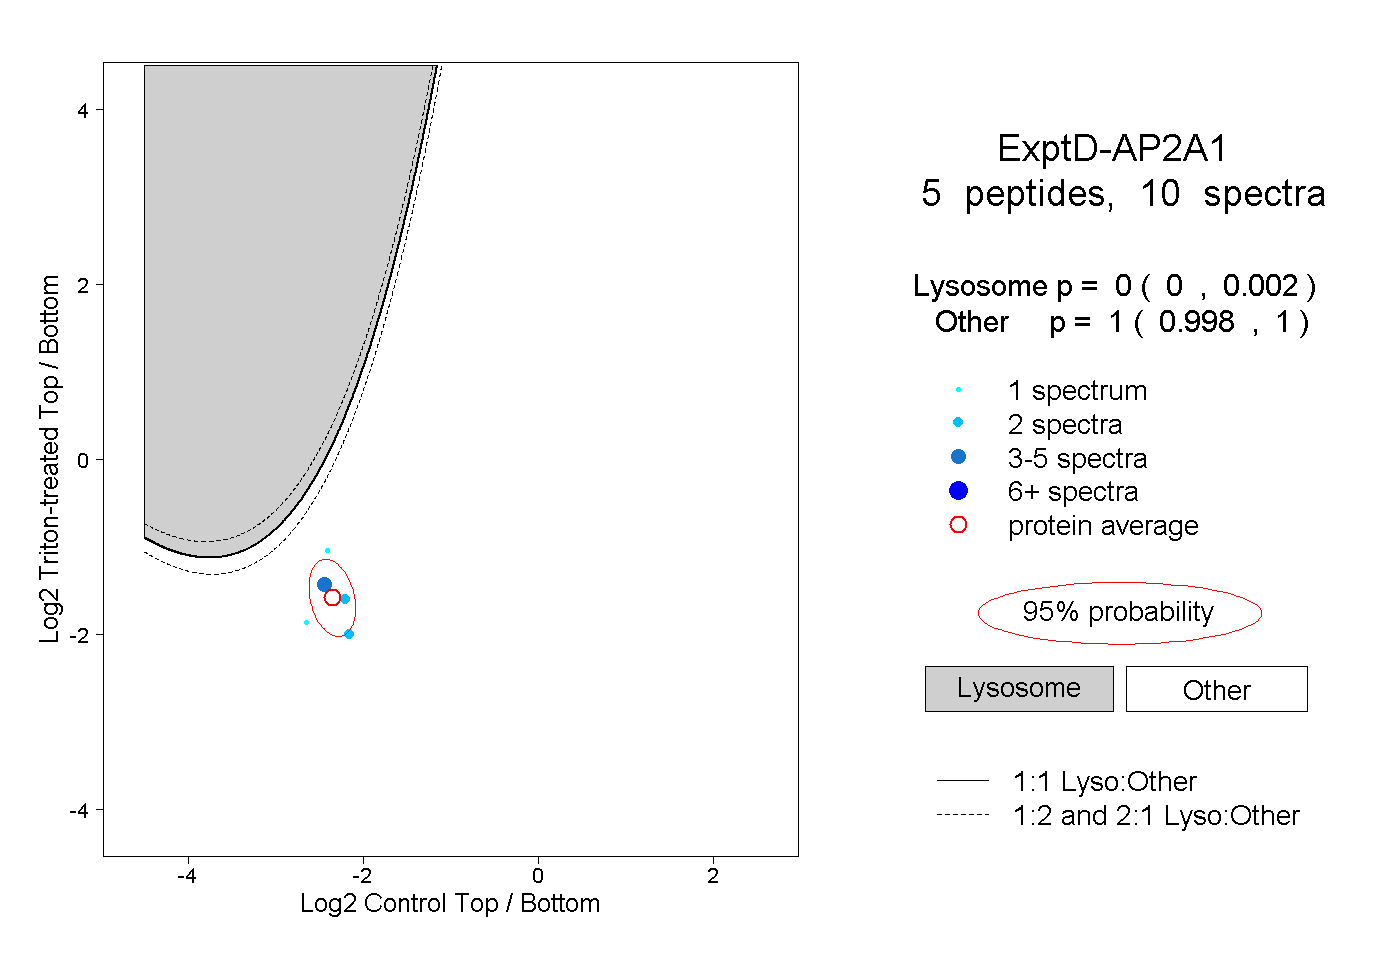
0.000 | 0.002
0.998 | 1.000