AP2A1
[ENSRNOP00000020304]
Main page
| | | Plot |
Mito |
Lyso |
|
Perox |
ER |
Golgi |
PM |
Cytosol |
Nucleus |
|
| Expt A |
 42
42
peptides |
168
spectra |
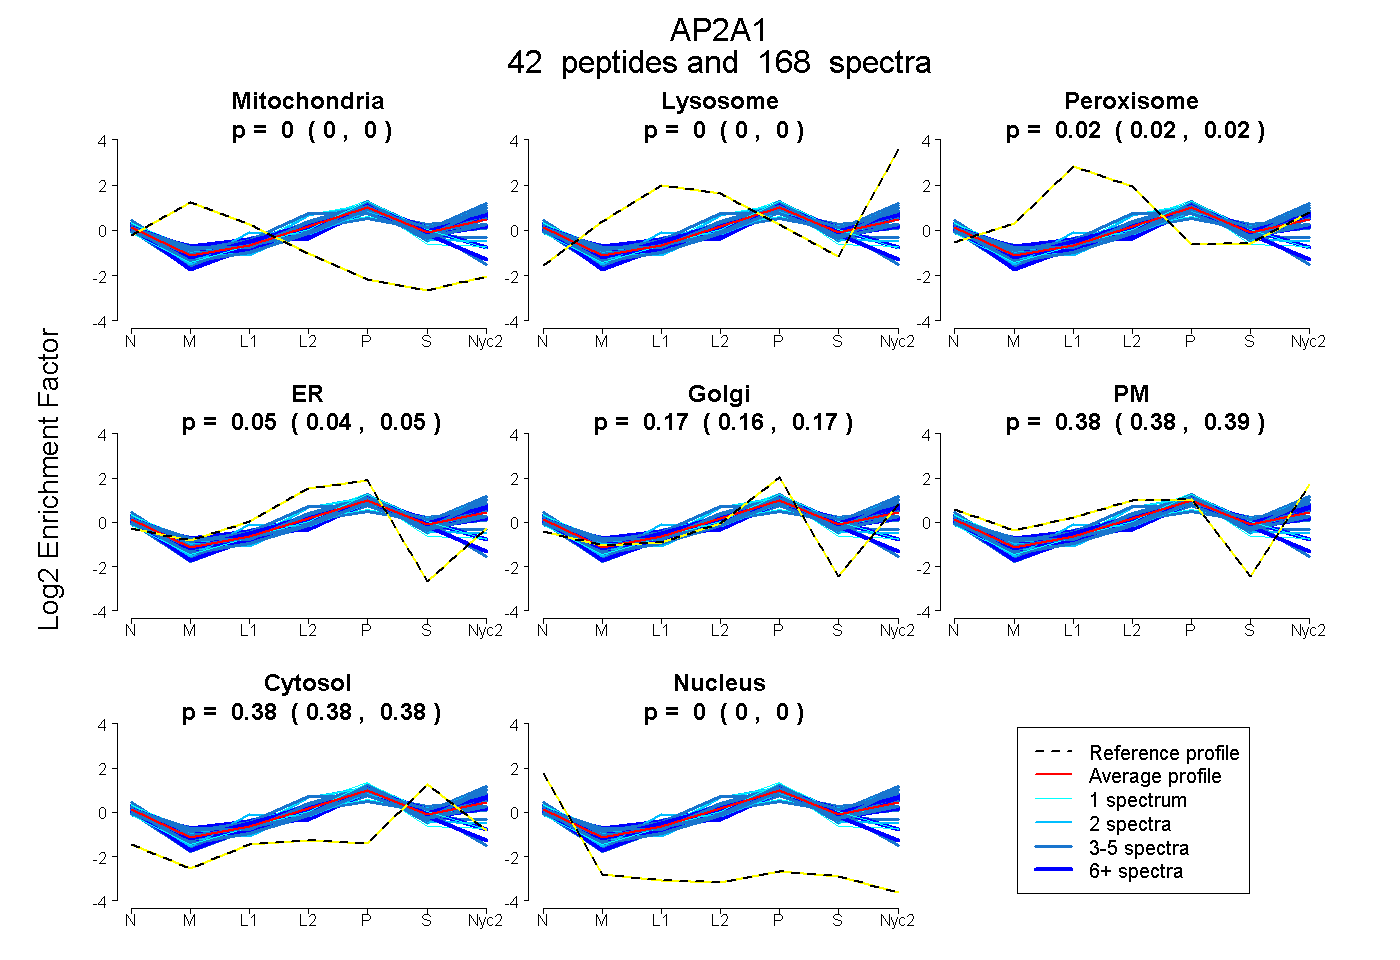 |
0.000
0.000 | 0.000 |
0.000
0.000 | 0.000 |
|
0.020
0.018 | 0.021 |
0.048
0.041 | 0.054 |
0.169
0.163 | 0.173 |
0.384
0.380 | 0.388 |
0.379
0.378 | 0.381 |
0.000
0.000 | 0.000 |
|
| | | Plot |
Mito |
|
Lyso or Perox |
|
ER |
Golgi |
PM |
Cytosol |
Nucleus |
|
| Expt B |
4
peptides |
9
spectra |
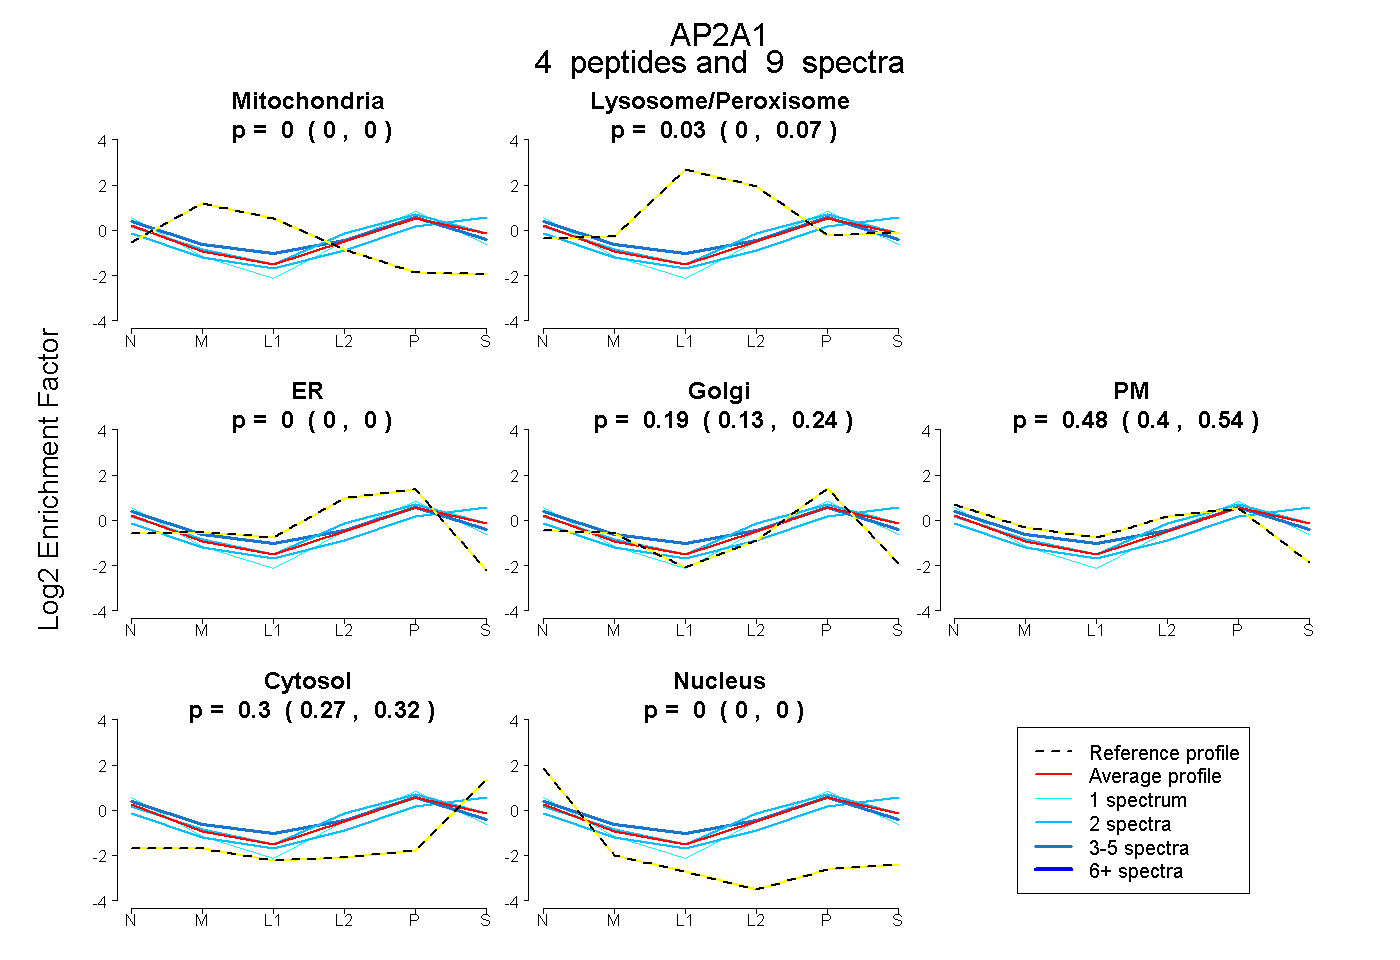 |
0.000
0.000 | 0.000 |
|
0.034
0.000 | 0.065 |
|
0.000
0.000 | 0.000 |
0.188
0.128 | 0.239 |
0.480
0.401 | 0.544 |
0.297
0.273 | 0.319 |
0.000
0.000 | 0.000 |
|
| 2 spectra, VLQIVTNR |
0.000 |
|
0.095 |
|
0.000 |
0.285 |
0.377 |
0.243 |
0.000 |
|
| 4 spectra, LVECLETVLNK |
0.000 |
|
0.074 |
|
0.000 |
0.121 |
0.578 |
0.226 |
0.000 |
|
| 1 spectrum, ALQVGCLLR |
0.000 |
|
0.000 |
|
0.000 |
0.406 |
0.385 |
0.192 |
0.018 |
|
| 2 spectra, ATIQGVLR |
0.000 |
|
0.048 |
|
0.000 |
0.175 |
0.296 |
0.481 |
0.000 |
|
| | | Plot |
|
Lyso |
|
|
|
|
|
|
|
Other |
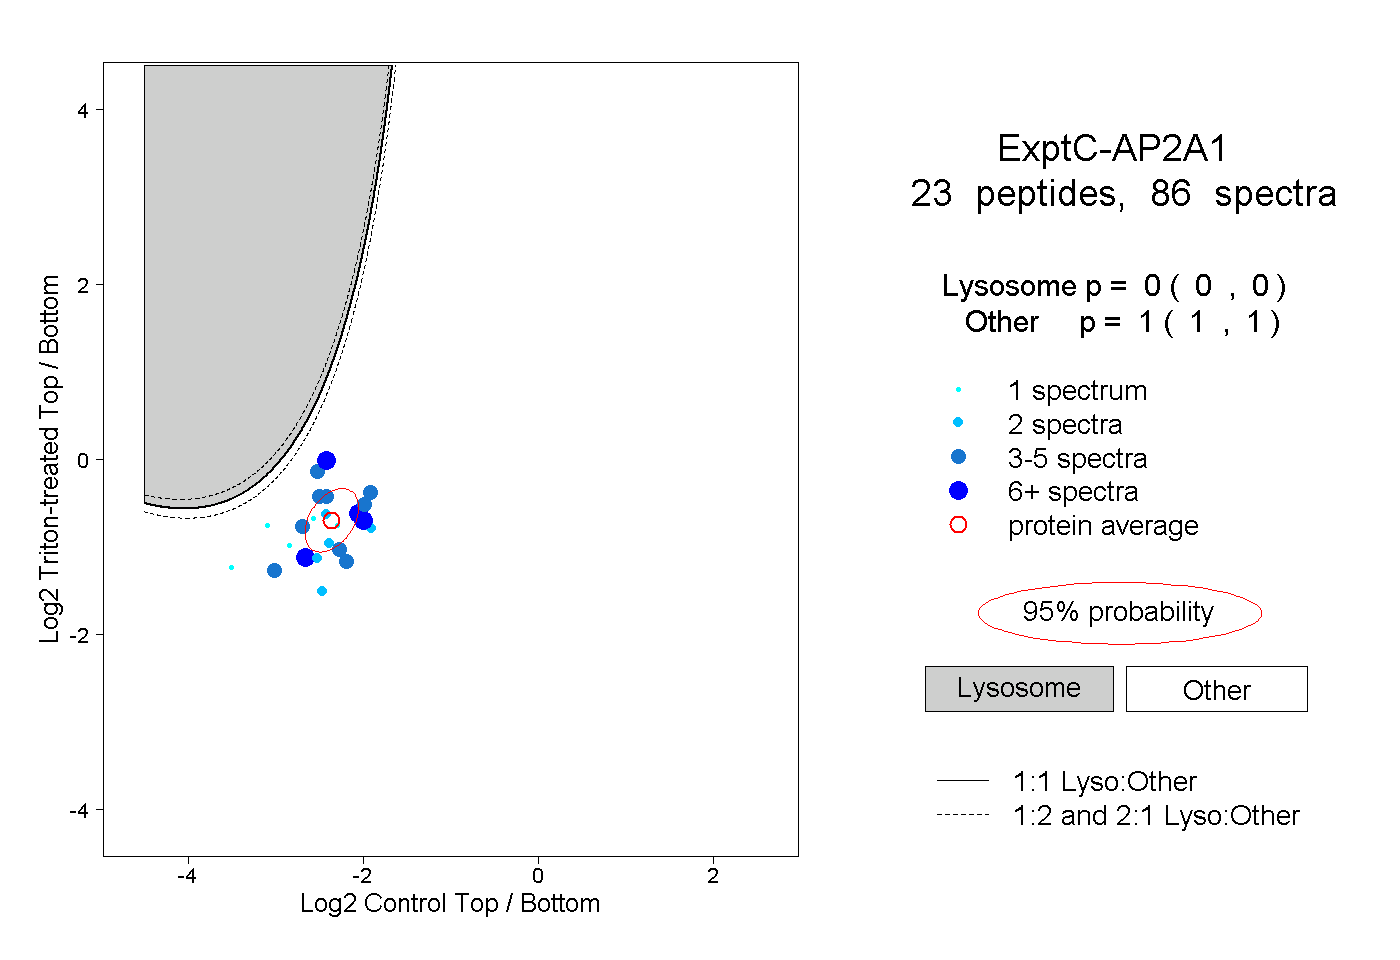
| Expt C |
23
peptides |
86
spectra |
 |
|
0.000
0.000 | 0.000 |
|
|
|
|
|
|
|
1.000
1.000 | 1.000 |
| | | Plot |
|
Lyso |
|
|
|
|
|
|
|
Other |
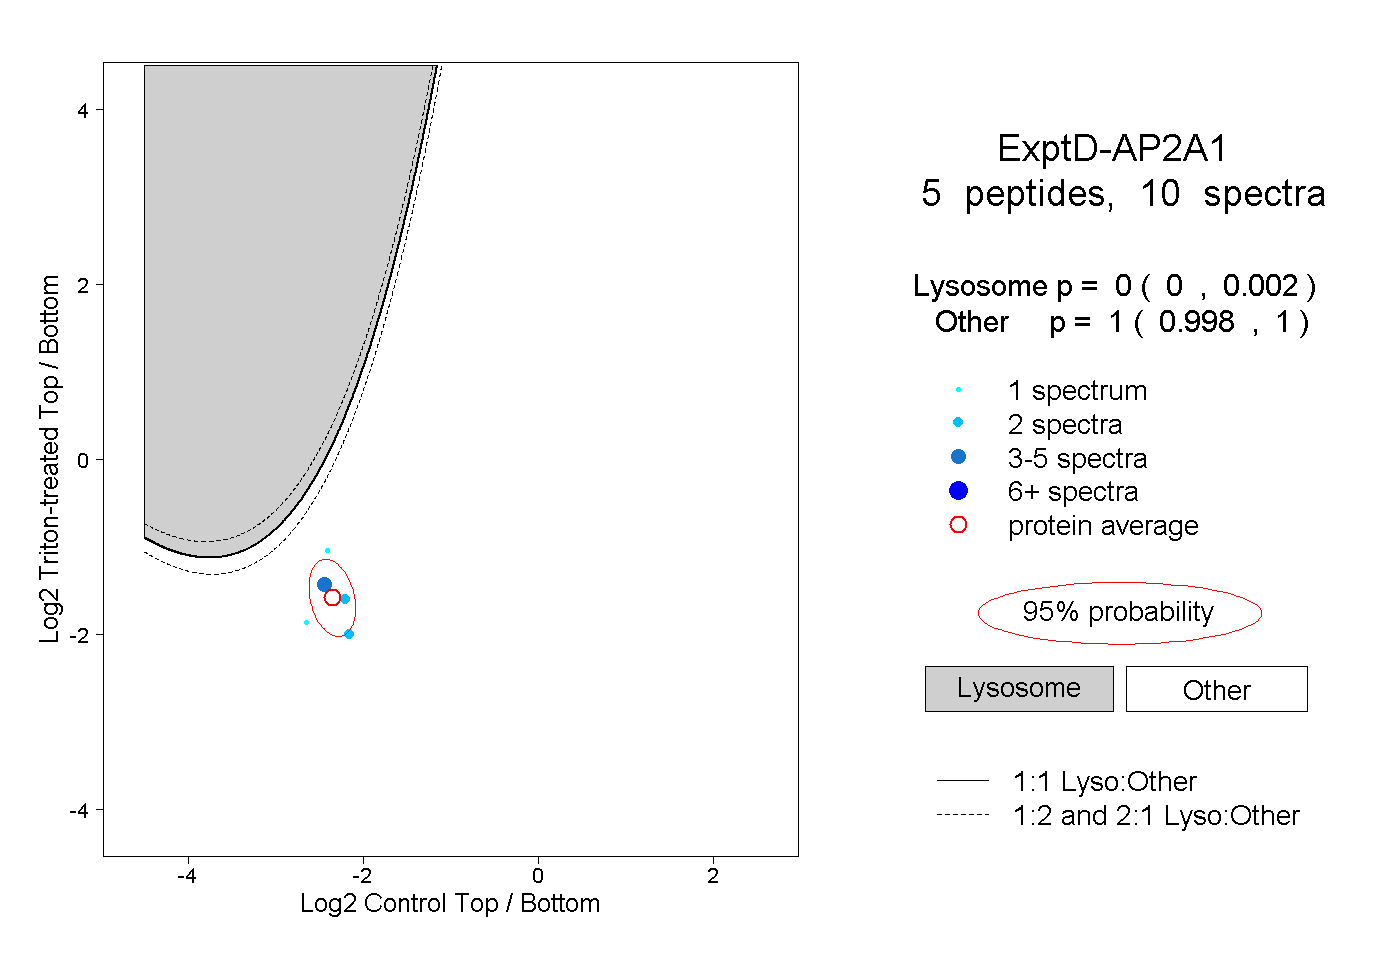
| Expt D |
5
peptides |
10
spectra |
 |
|
0.000
0.000 | 0.002 |
|
|
|
|
|
|
|
1.000
0.998 | 1.000 |