 2
2peptides
spectra
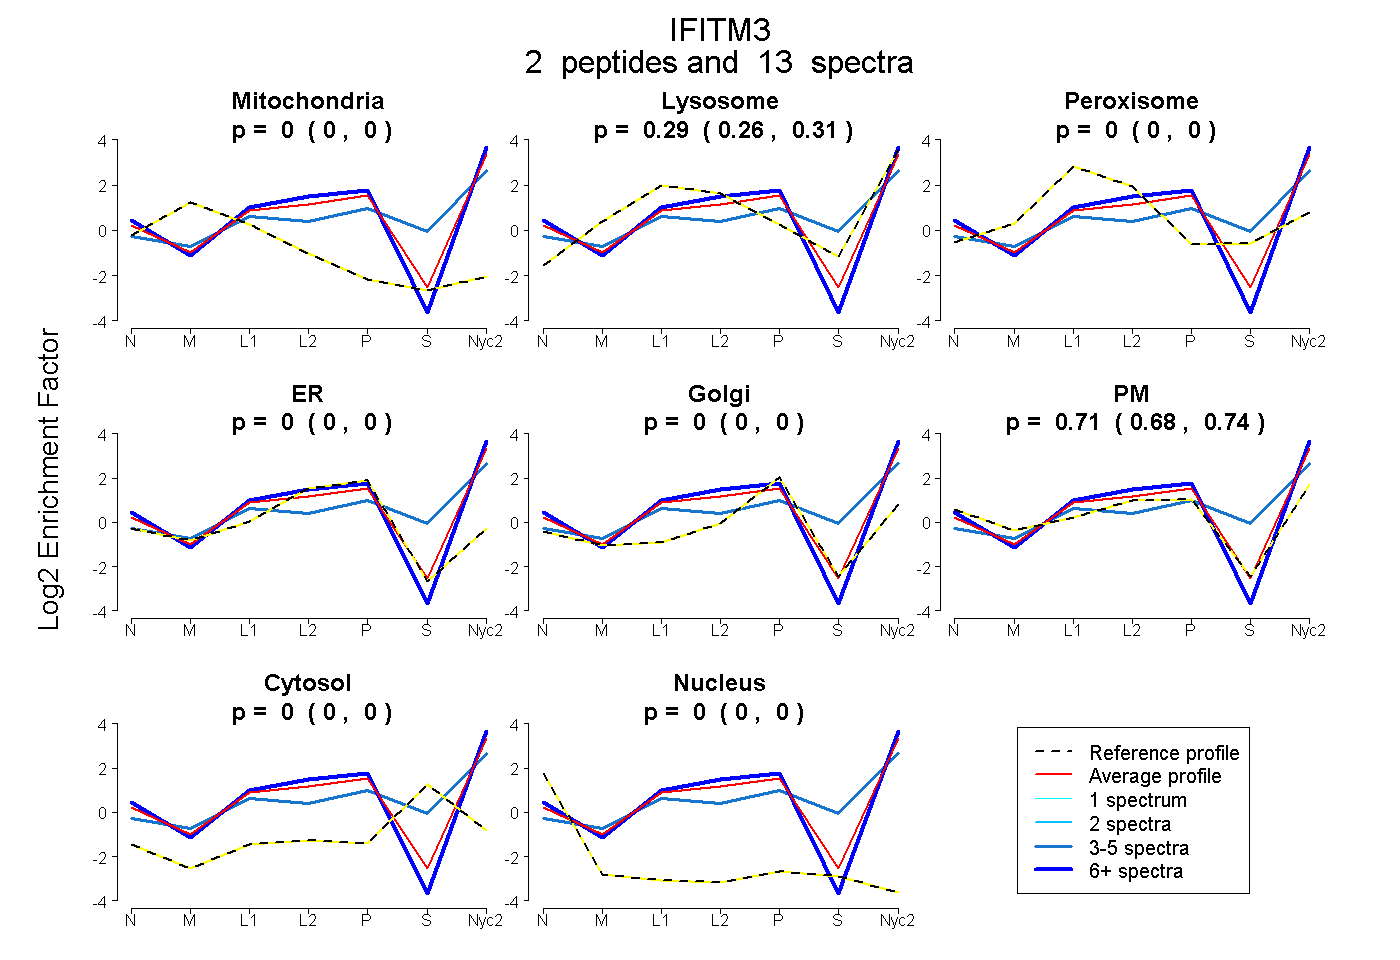
0.000 | 0.000
0.257 | 0.313
0.000 | 0.000
0.000 | 0.000
0.000 | 0.000
0.683 | 0.739
0.000 | 0.000
0.000 | 0.000
2peptides
spectra
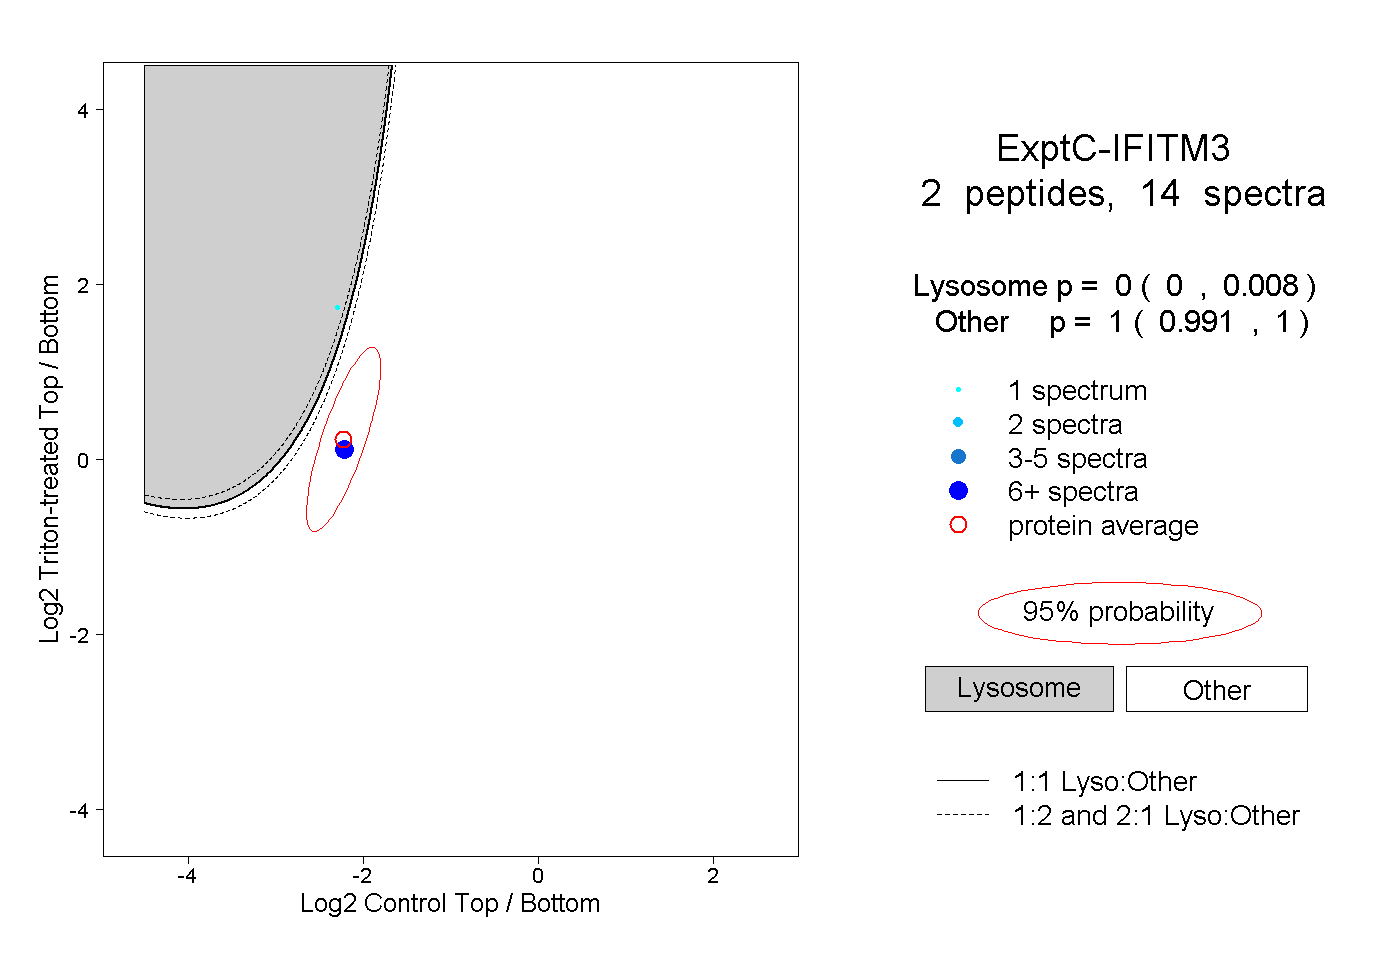
0.000 | 0.008
0.991 | 1.000
1peptide
spectra
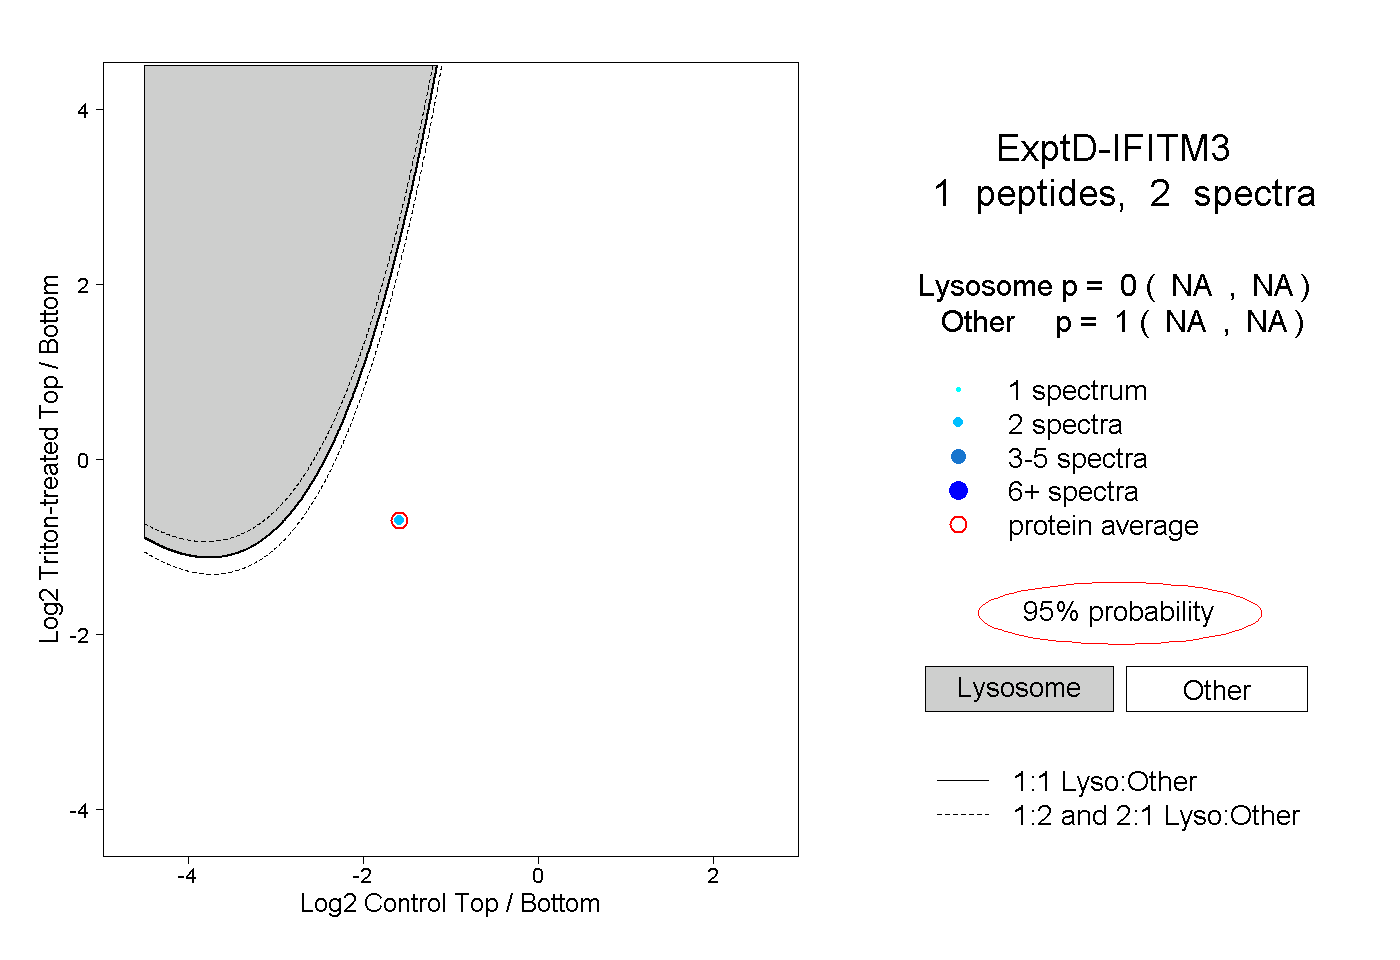
NA | NA
NA | NA