11
11peptides
spectra
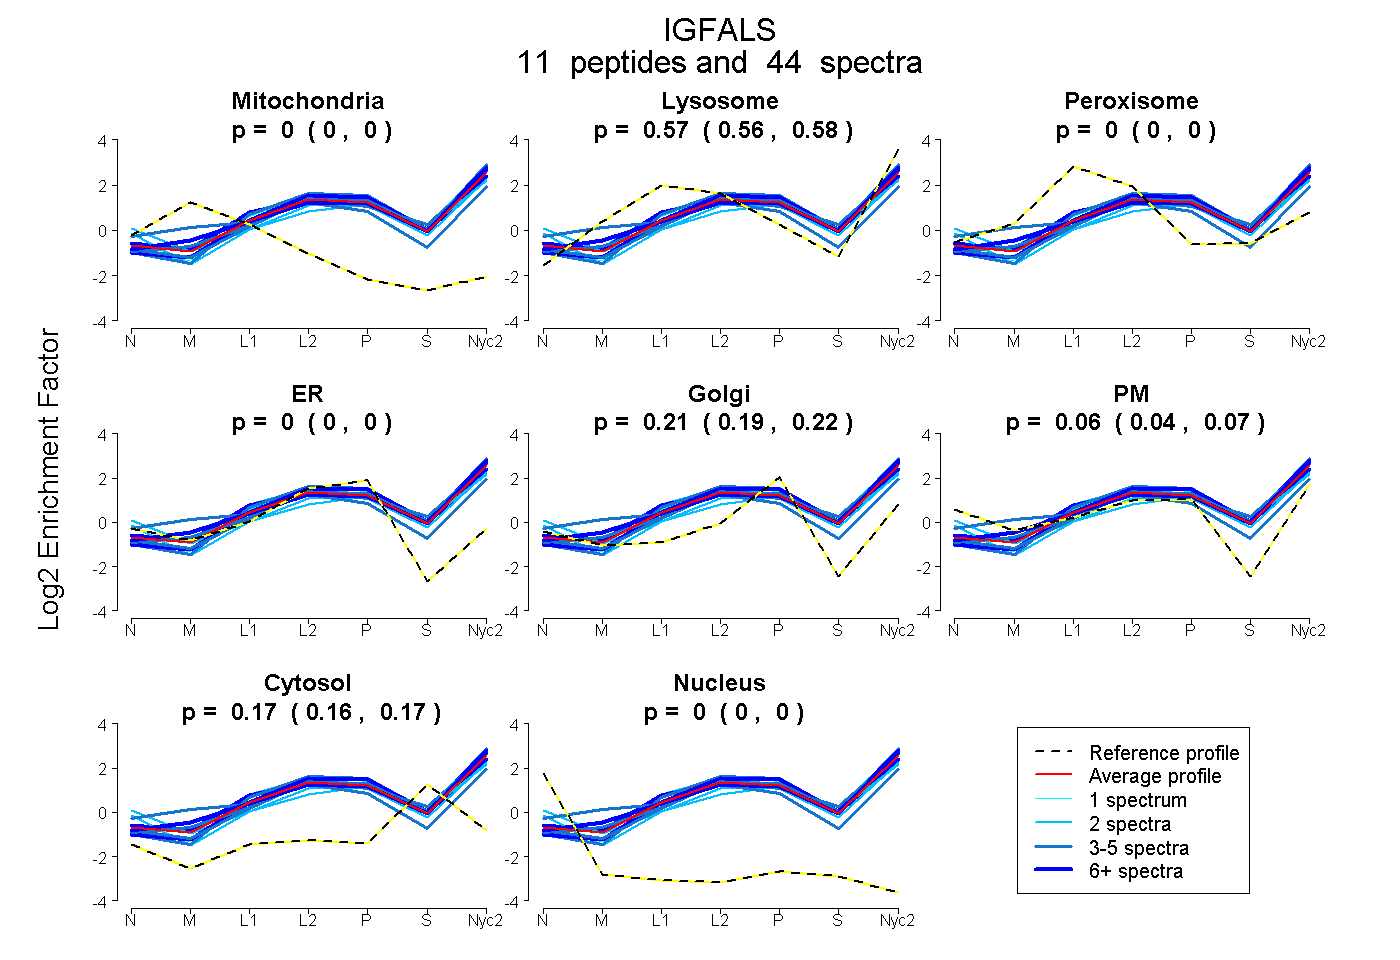
0.000 | 0.000
0.560 | 0.576
0.000 | 0.000
0.000 | 0.000
0.192 | 0.217
0.039 | 0.074
0.163 | 0.171
0.000 | 0.000
7peptides
spectra
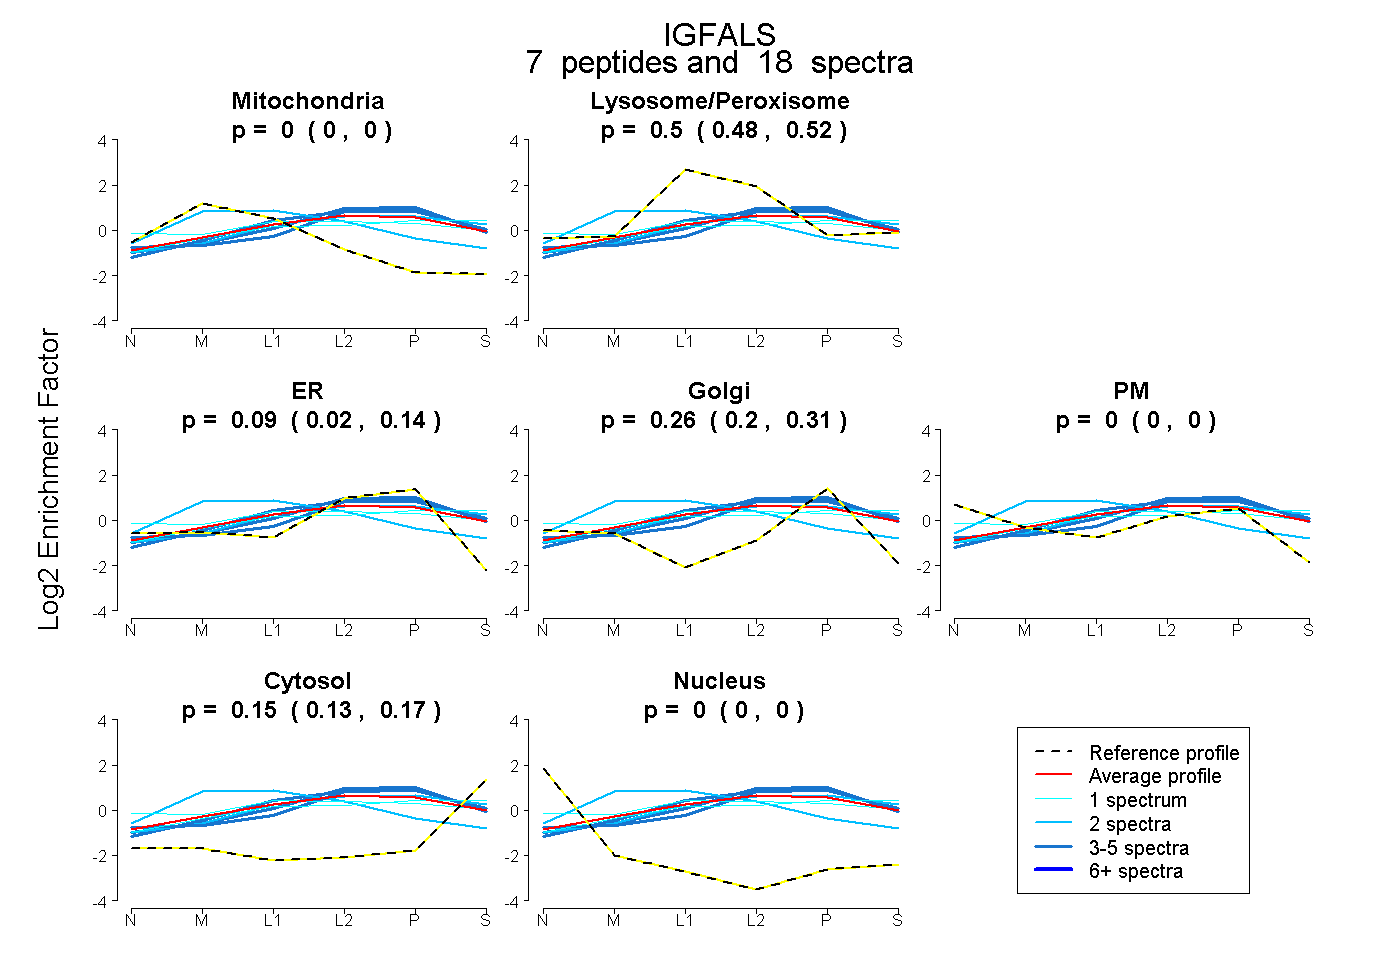
0.000 | 0.000
0.476 | 0.522
0.022 | 0.138
0.200 | 0.306
0.000 | 0.000
0.132 | 0.173
0.000 | 0.000