 11
11peptides
spectra
0.000 | 0.000
0.560 | 0.576
0.000 | 0.000
0.000 | 0.000
0.192 | 0.217
0.039 | 0.074
0.163 | 0.171
0.000 | 0.000
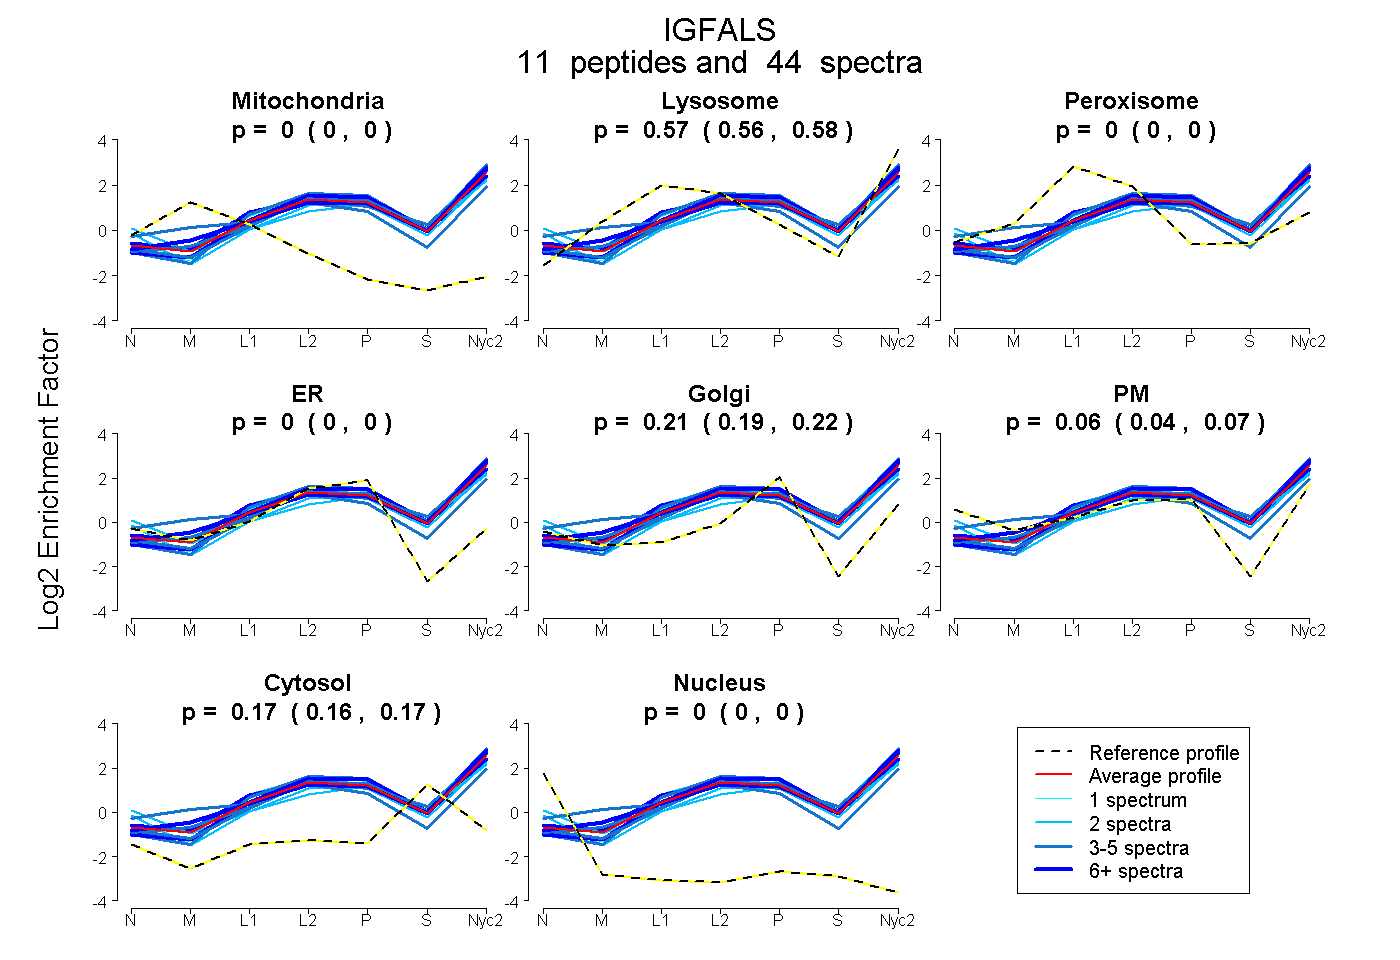
| Plot | Mito | Lyso | Perox | ER | Golgi | PM | Cytosol | Nucleus | |||||
| Expt A |
11 peptides |
44 spectra |
|
0.000 0.000 | 0.000 |
0.570 0.560 | 0.576 |
0.000 0.000 | 0.000 |
0.000 0.000 | 0.000 |
0.206 0.192 | 0.217 |
0.058 0.039 | 0.074 |
0.167 0.163 | 0.171 |
0.000 0.000 | 0.000 |
| 3 spectra, VFQGLDK | 0.000 | 0.598 | 0.000 | 0.000 | 0.244 | 0.000 | 0.157 | 0.000 | ||
| 7 spectra, LTHLPR | 0.000 | 0.609 | 0.000 | 0.000 | 0.238 | 0.000 | 0.153 | 0.000 | ||
| 2 spectra, AFLGMK | 0.000 | 0.684 | 0.000 | 0.000 | 0.187 | 0.000 | 0.130 | 0.000 | ||
| 9 spectra, WLDLSHNR | 0.000 | 0.629 | 0.000 | 0.000 | 0.228 | 0.000 | 0.143 | 0.000 | ||
| 6 spectra, ANVFVHLPR | 0.000 | 0.561 | 0.000 | 0.064 | 0.062 | 0.131 | 0.181 | 0.000 | ||
| 3 spectra, LHTFAGLSGLR | 0.000 | 0.358 | 0.038 | 0.036 | 0.000 | 0.439 | 0.128 | 0.000 | ||
| 4 spectra, NLITAVAPR | 0.000 | 0.580 | 0.000 | 0.000 | 0.190 | 0.000 | 0.230 | 0.000 | ||
| 5 spectra, LAHNAIASLRPR | 0.000 | 0.637 | 0.000 | 0.000 | 0.222 | 0.000 | 0.141 | 0.000 | ||
| 2 spectra, ELDLSR | 0.000 | 0.328 | 0.000 | 0.000 | 0.117 | 0.284 | 0.270 | 0.000 | ||
| 2 spectra, DLHFLEELQLGHNR | 0.000 | 0.299 | 0.000 | 0.000 | 0.000 | 0.490 | 0.211 | 0.000 | ||
| 1 spectrum, DFALQNPGVVPR | 0.000 | 0.646 | 0.000 | 0.000 | 0.185 | 0.000 | 0.169 | 0.000 |
| Plot | Mito | Lyso or Perox | ER | Golgi | PM | Cytosol | Nucleus | ||||||
| Expt B |
7 peptides |
18 spectra |
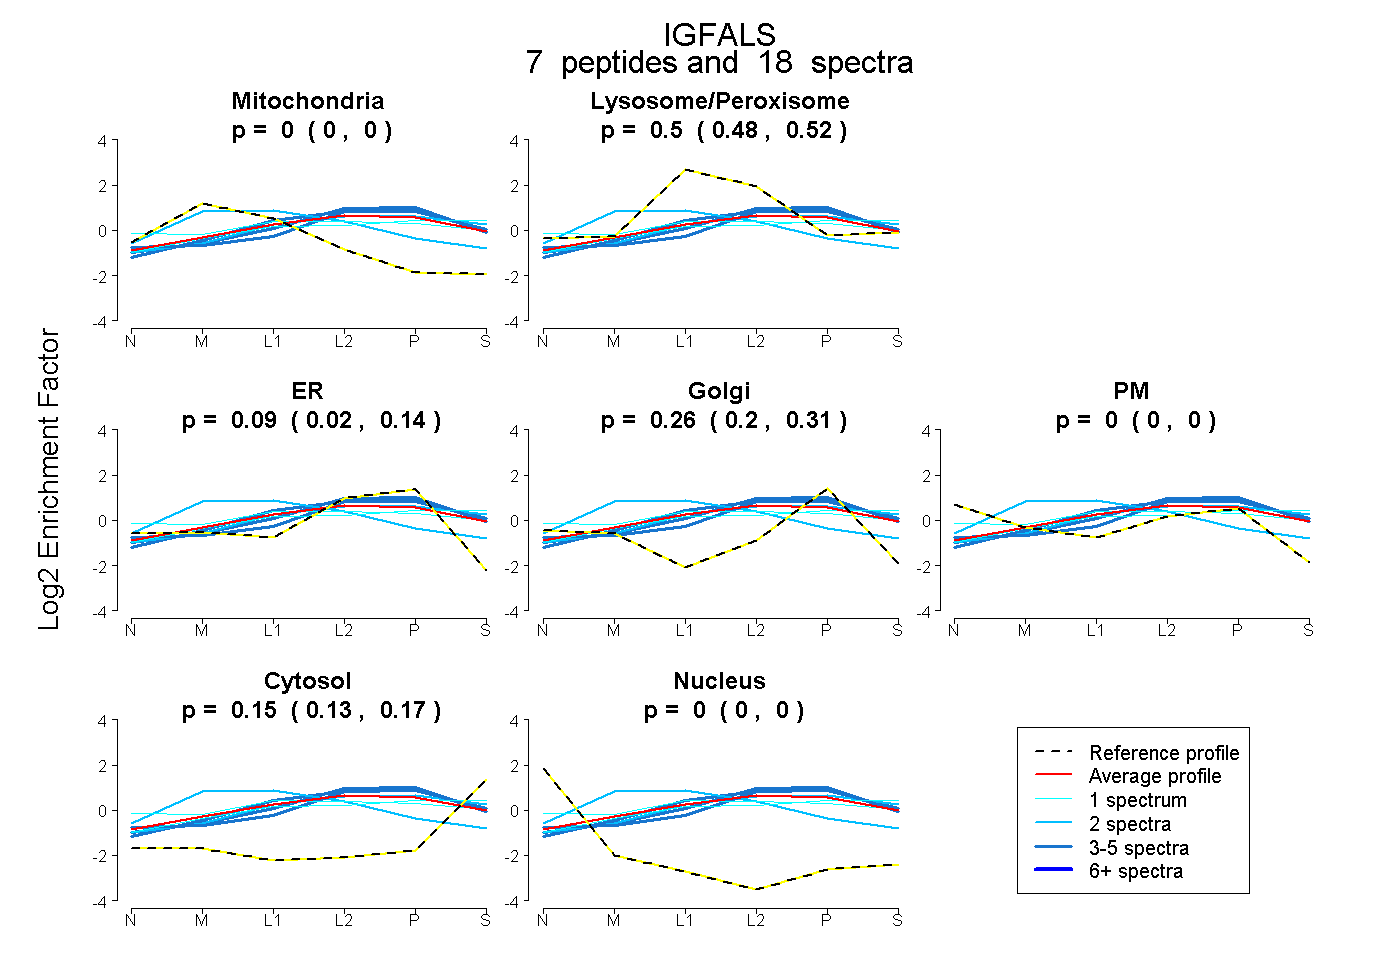 |
0.000 0.000 | 0.000 |
0.502 0.476 | 0.522 |
0.086 0.022 | 0.138 |
0.258 0.200 | 0.306 |
0.000 0.000 | 0.000 |
0.154 0.132 | 0.173 |
0.000 0.000 | 0.000 |
|||
| Plot | Lyso | Other | |||||||||||
| Expt C |
9 peptides |
34 spectra |
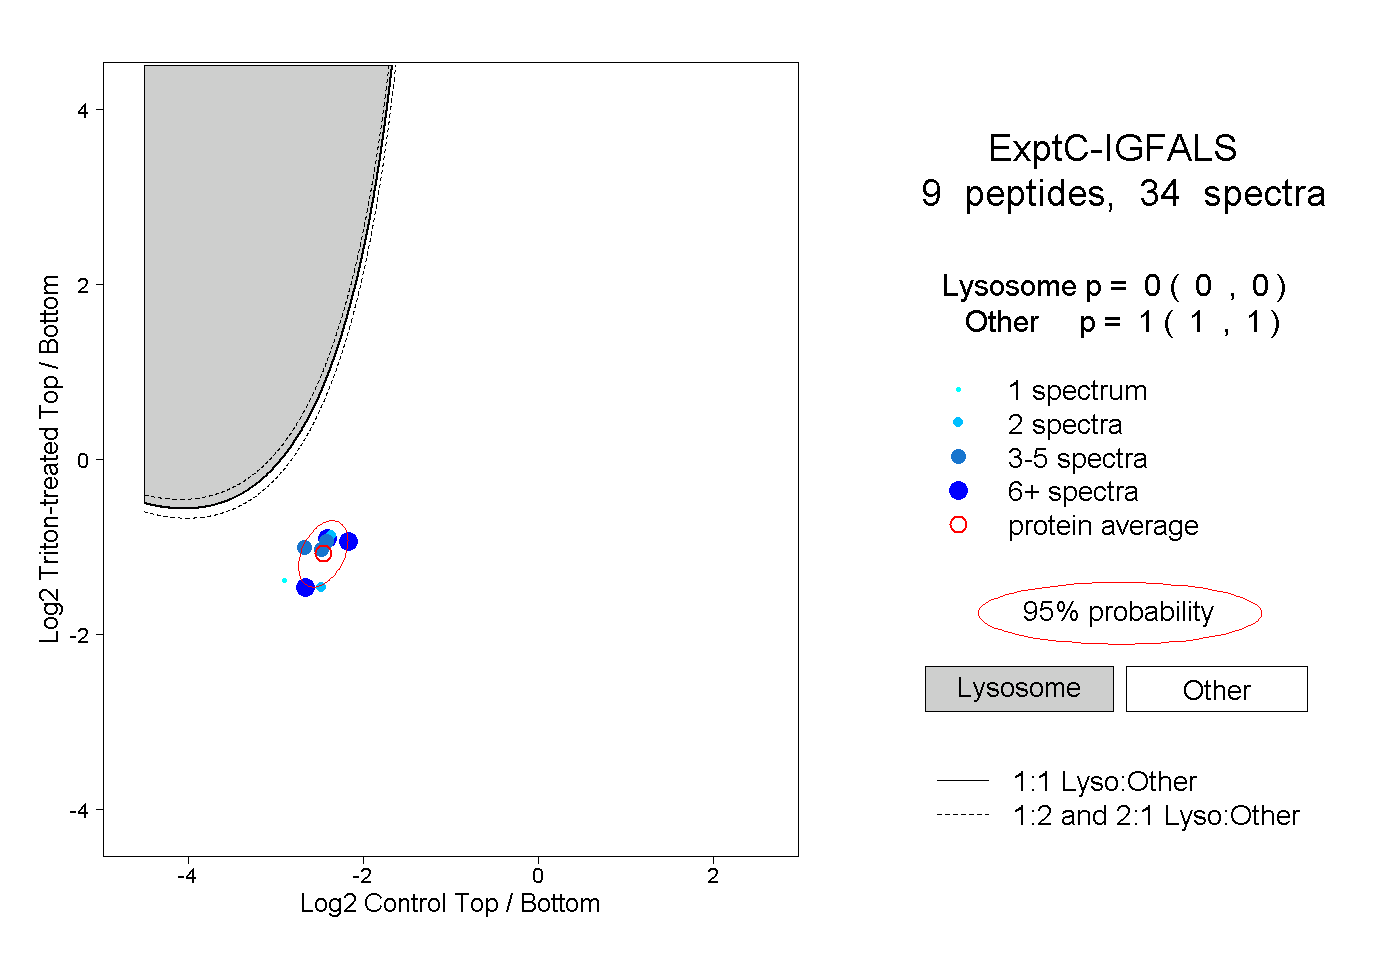 |
0.000 0.000 | 0.000 |
1.000 1.000 | 1.000 |
||||||||
| Plot | Lyso | Other | |||||||||||
| Expt D |
5 peptides |
7 spectra |
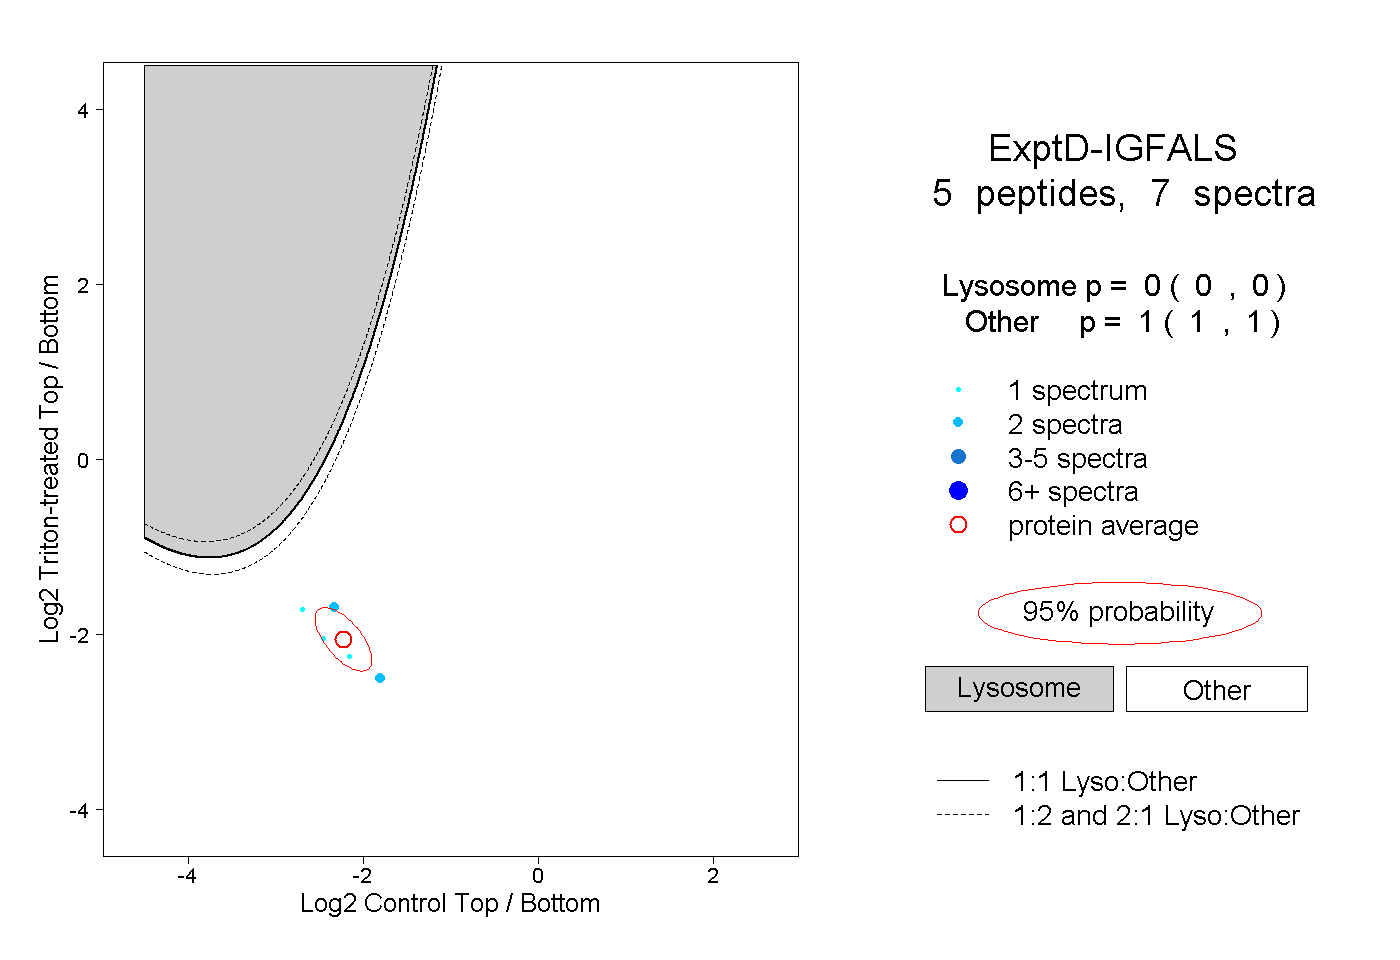 |
0.000 0.000 | 0.000 |
1.000 1.000 | 1.000 |