PEX11A
[ENSRNOP00000020229]
Main page
| | | Plot |
Mito |
Lyso |
|
Perox |
ER |
Golgi |
PM |
Cytosol |
Nucleus |
|
| Expt A |
 7
7
peptides |
30
spectra |
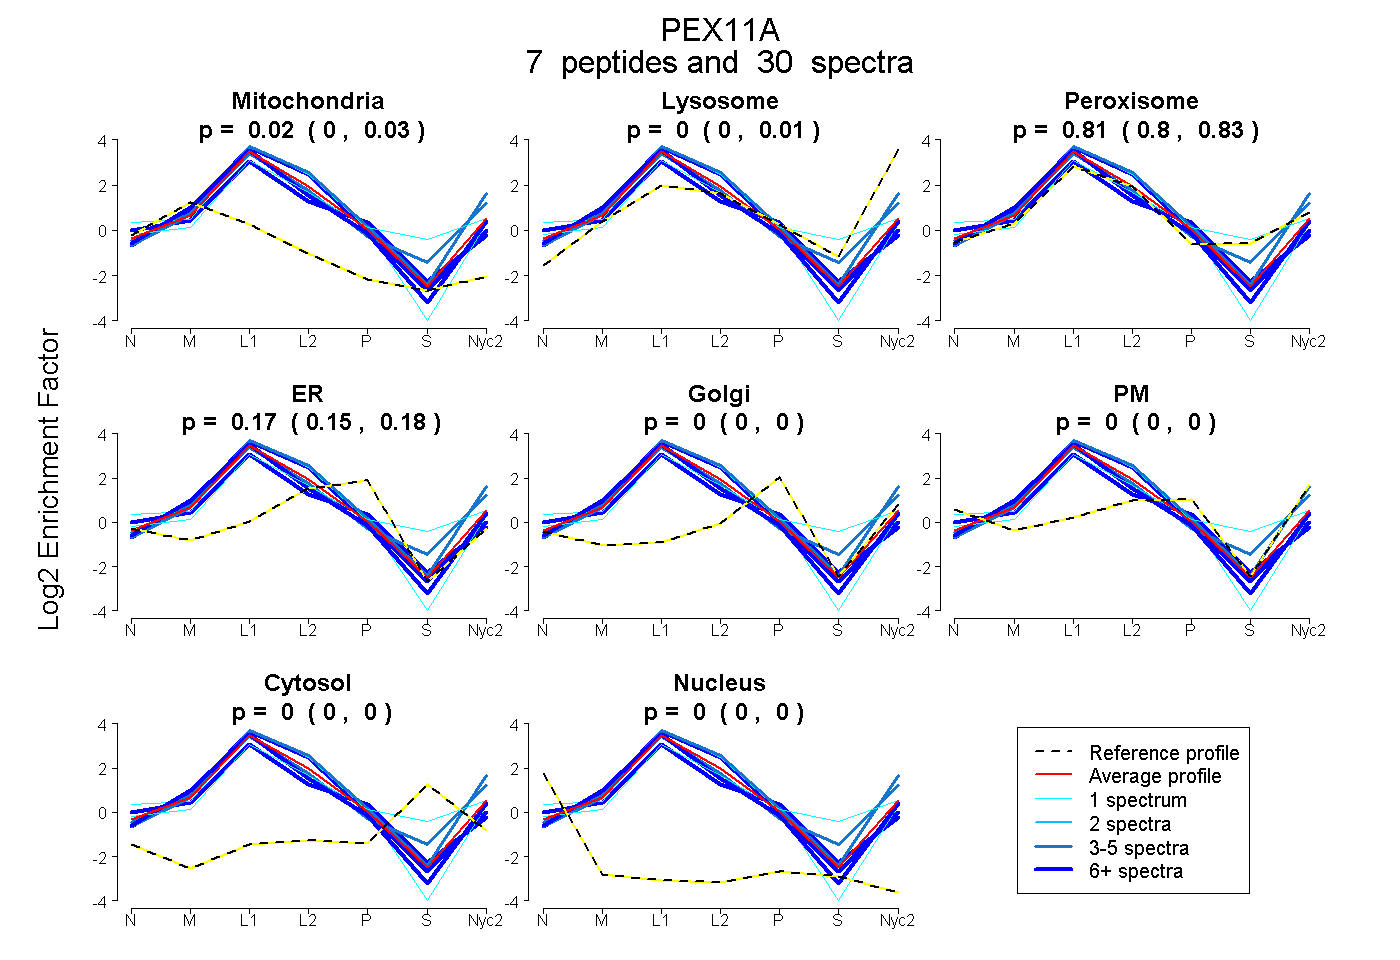 |
0.018
0.003 | 0.029 |
0.000
0.000 | 0.008 |
|
0.814
0.796 | 0.828 |
0.168
0.154 | 0.176 |
0.000
0.000 | 0.000 |
0.000
0.000 | 0.000 |
0.000
0.000 | 0.000 |
0.000
0.000 | 0.000 |
|
| | | Plot |
Mito |
|
Lyso or Perox |
|
ER |
Golgi |
PM |
Cytosol |
Nucleus |
|
| Expt B |
6
peptides |
8
spectra |
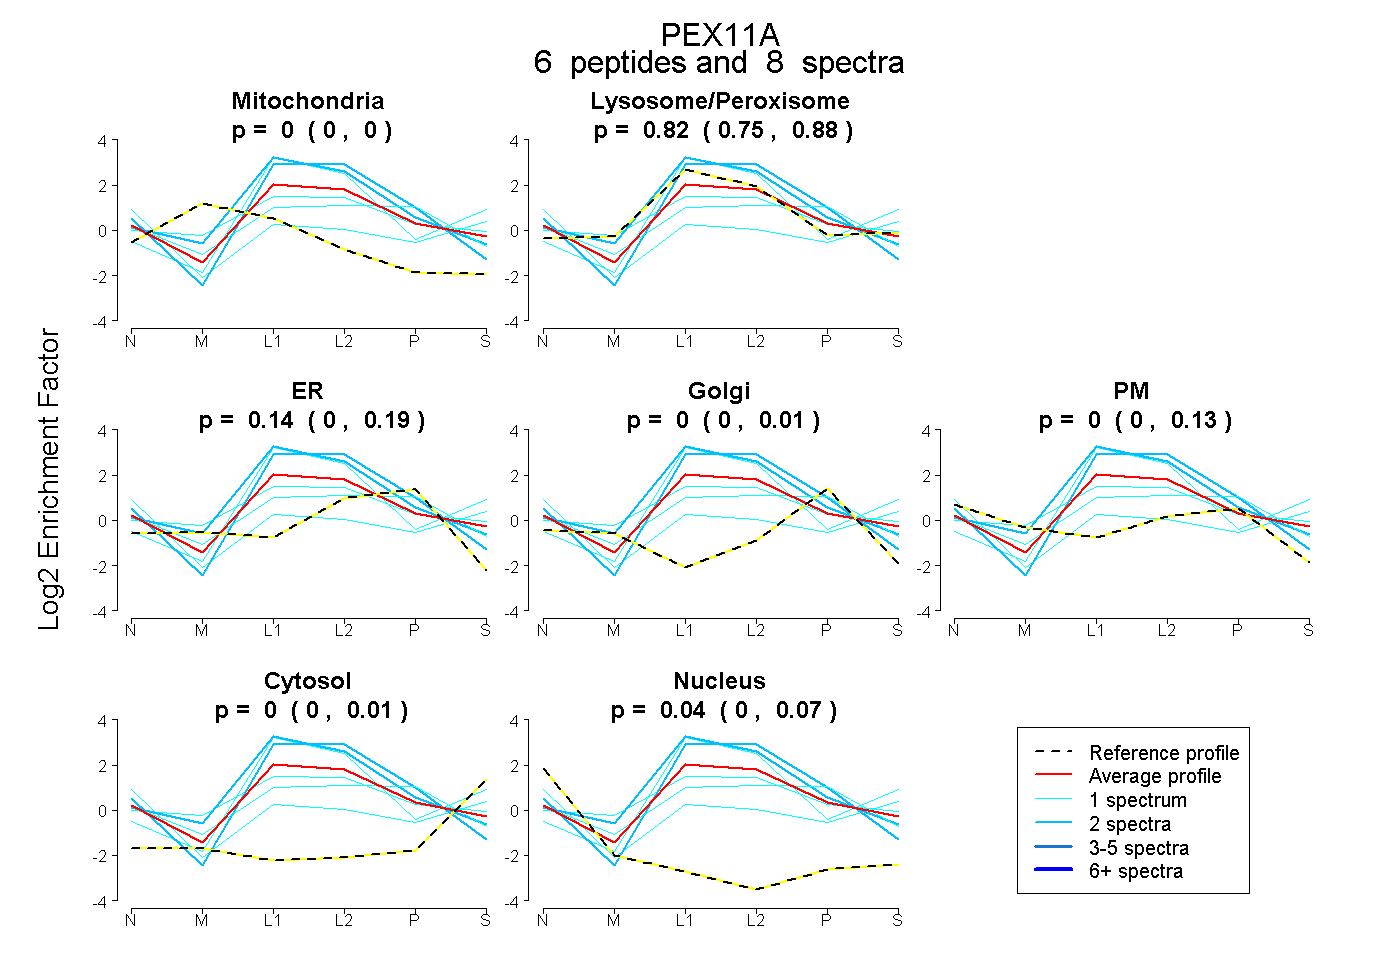 |
0.000
0.000 | 0.000 |
|
0.822
0.748 | 0.879 |
|
0.137
0.004 | 0.187 |
0.000
0.000 | 0.013 |
0.000
0.000 | 0.125 |
0.000
0.000 | 0.013 |
0.041
0.000 | 0.067 |
|
| 1 spectrum, LCLTLANLNR |
0.000 |
|
1.000 |
|
0.000 |
0.000 |
0.000 |
0.000 |
0.000 |
|
| 1 spectrum, EAVVTK |
0.000 |
|
0.552 |
|
0.000 |
0.000 |
0.000 |
0.195 |
0.254 |
|
| 2 spectra, NLETSVSTGR |
0.000 |
|
0.842 |
|
0.158 |
0.000 |
0.000 |
0.000 |
0.000 |
|
| 1 spectrum, ATQHACMLLR |
0.000 |
|
0.744 |
|
0.000 |
0.096 |
0.133 |
0.027 |
0.000 |
|
| 1 spectrum, SSGDPPK |
0.000 |
|
0.541 |
|
0.184 |
0.184 |
0.090 |
0.000 |
0.000 |
|
| 2 spectra, NPPLFLDTVK |
0.000 |
|
1.000 |
|
0.000 |
0.000 |
0.000 |
0.000 |
0.000 |
|
| | | Plot |
|
Lyso |
|
|
|
|
|
|
|
Other |
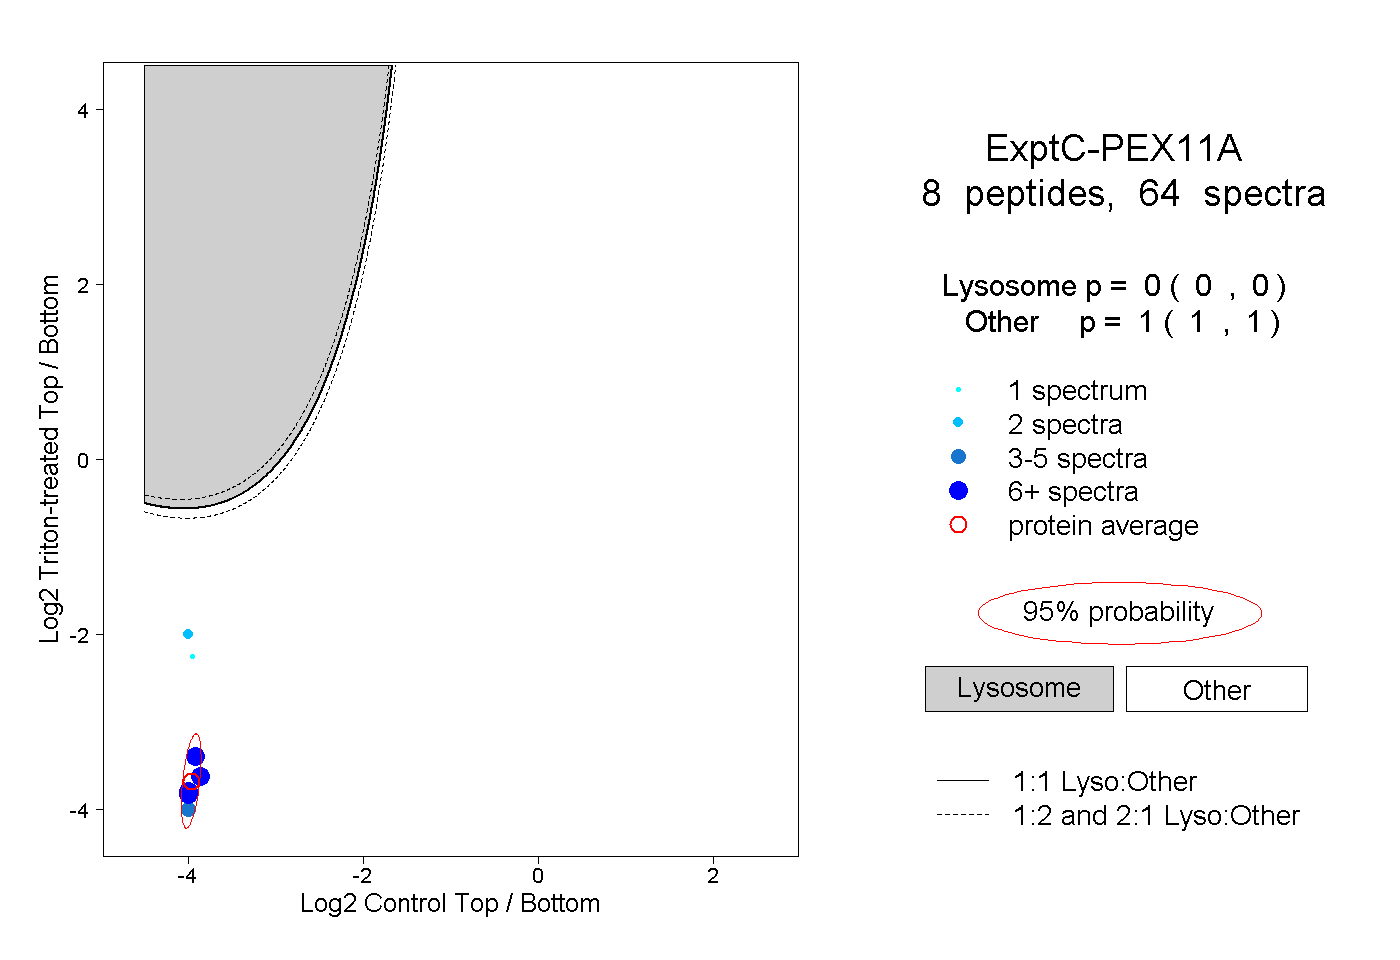
| Expt C |
8
peptides |
64
spectra |
 |
|
0.000
0.000 | 0.000 |
|
|
|
|
|
|
|
1.000
1.000 | 1.000 |
| | | Plot |
|
Lyso |
|
|
|
|
|
|
|
Other |
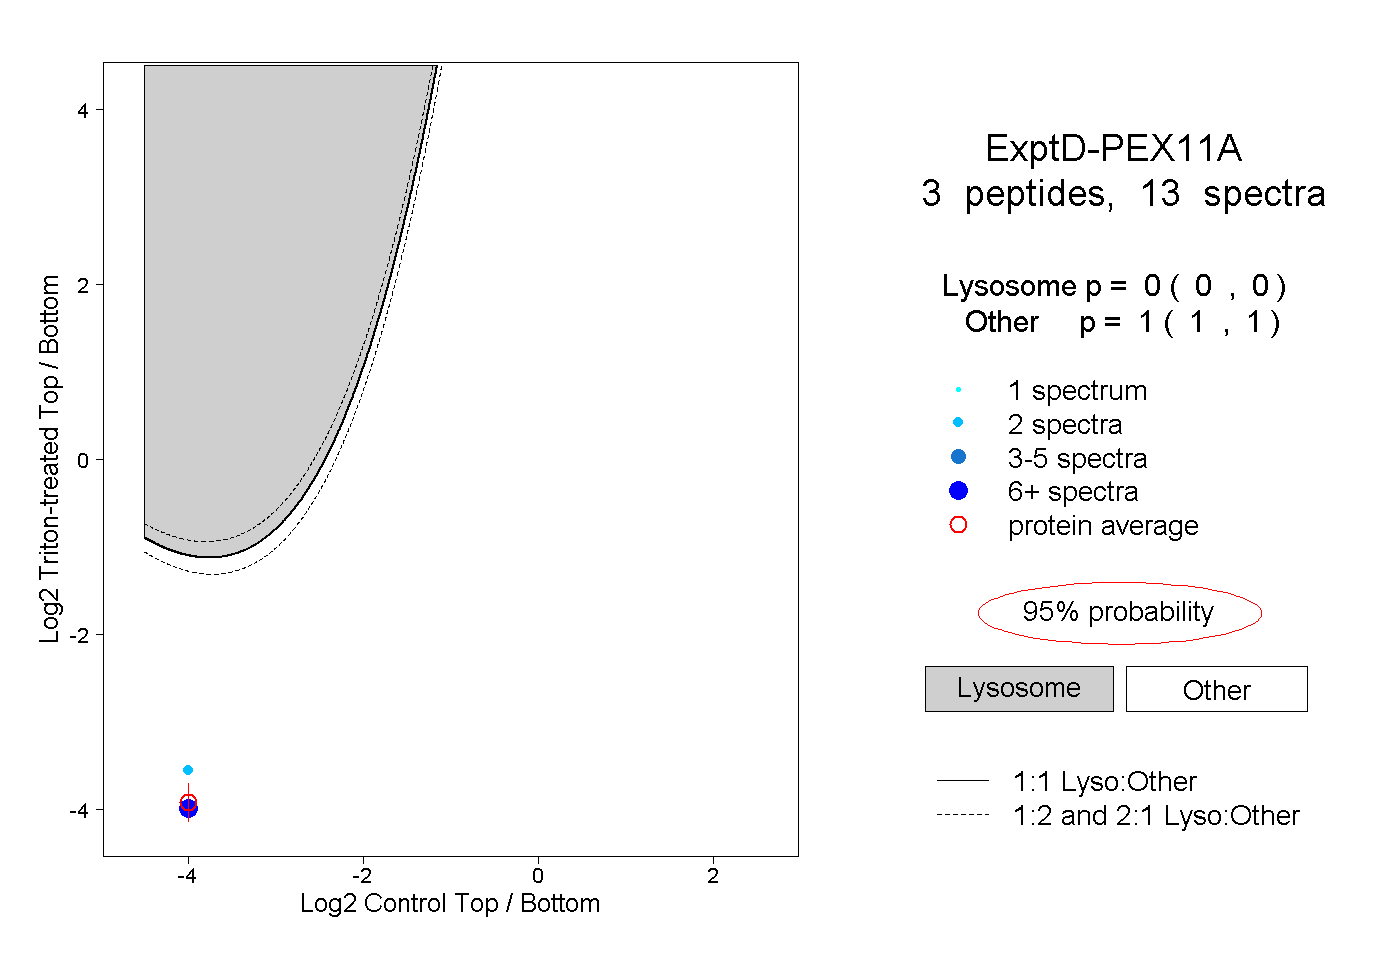
| Expt D |
3
peptides |
13
spectra |
 |
|
0.000
0.000 | 0.000 |
|
|
|
|
|
|
|
1.000
1.000 | 1.000 |